Efficient alternate energy portable fuels are required to end our dependence on fossil fuels. Hydrogen holds the most promise in that reguard. Exploring the paths open for meeting the goal of energy independence is the object of this blog. Hopefully you will find it interesting and informative.
Sunday, April 17, 2011
More on the Greenhouse Effect
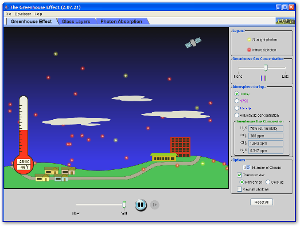
I just added this Java Applet from the University of Colorado to play with. Clouds are the main question marks in the General Circulation Models followed by the oceans. My look at the simple radiation models is considered not that big an issue. Still, the models assume that nonlinear forcings are less than 10% of the total forcing that impacts climate change. Looking at the period 1910 to 1940 in the surface temperature record, I am not so sure the less than 10% estimate is all that great. Since the big El Nino of 1998, things have started slowing down as far as warming. The apparent lack of warming is probably due to the nonlinear forcings doing more of their thing than normally observed.
The change in the Pacific Decadal Oscillation (PDO) is probably a major part of the stalled warming. But the PDO just moves heat around. You can't just say, "It's the PDO Stupid!", without showing some mechanism for improve heat loss that may have a longer period cooling impact. So if it is just an oscillation, what goes around comes around, everything averages, there is no longer term impact on temperature. It looks likely to me that Tropopause had the potential to have longer term impact than it is generally give credit. Hey! It's my theory. I just have to find a way to show that there is more to it than most folks think. So before I start in on all the neat radiative balance things the Tropopause can do, I figure we can play with this neat model and see what it may be missing.
With this little animation you can add only a few clouds. The average cloud cover is around 70% with big variation by season except of desert areas. The little animation also shows little red balls that bounce around a little in the lower atmosphere, but have clean shots to the surface pretty often. There are very few of those clean shots in reality. The atmosphere gets thicker optically to the red balls at lower altitudes, so there is really much more bouncing around. So it is kind of a childish animation that tends to over emphasis the impact not showing the reality. It does show a little bouncing around in the middle atmosphere. Since my programming and drawing skills suck, I will try to type my way through my thoughts with the next post.
Subscribe to:
Post Comments (Atom)
Blog Archive
-
▼
2011
(190)
-
▼
April
(33)
- Where is the Future?
- Our Hydrogen Home - Is it Worth it?
- The Trends?
- Scale Matters
- That Simple Greenhouse Effect
- It is Time to Pull the Trigger on Synfuels!
- More on that Whacky Tropopause
- More Natural Gas Pains
- Nuclear Power Thoughts with Fukushima in Mind
- Future Farming in Fukushima Prefecture
- The Zonal Potential Temperature plot above is fro...
- Things that Go Bump in the Twilight
- More on the Greenhouse Effect
- Sensitivity To Radiation - Things We Find When We ...
- That Silly Troposphere
- What the Frack! Now They Quibble About Natrual Gas
- Even More Radiation Stuff From Japan
- Livin' in a Spherical World
- What's Going On?
- More on the Troposphere Sink
- How Did I Screw Up My Energy Budget Answer and Wha...
- My (incorrect) Answer to the Energy Budget Puzzle
- The Energy Budget Puzzle
- How to Take Something Simple and Really Complicate...
- Pondering Climate Change
- The Wind and the Pickens' Plan
- Back to the Future - Hydrogen Power Motor Coach
- So Where Did the Back Radiation Go?
- Fuel Cells, Electric Drives and Other Fun Stuff
- My Fuel Cell Tahoe
- More on Fukushima Response
- The RV of the Future
- More on Synthetic Fuels
-
▼
April
(33)

No comments:
Post a Comment