Radiation is fascinating. I have had friends and relatives die of cancers and until fairly recently, radiation therapy was not an option. Now, radiation therapy is getting close to being my preferred treatment should I happen to get cancer. Malignant cells are pretty easy to kill, it is not killing the patient that is the trick. Surgical removal is still the most popular treatment by doctors, but I have seen too many friends have large sections of things cut out only to find that the cancer is still active. Chemotherapy has some effectiveness, but a lot of side effects. Done properly, radiation therapy does the job quite well with not a lot of side effects.
While looking into radiation, both as a therapy and as an energy source, I have picked up on a few interesting things. Since the world is freaked out over Fukushima fall out, I thought I would start putting some facts, as I understand them, down in a post. This post may grow as I learn more or scientists learn more about this fascinating subject. I do recommend that all new Geiger counter owners read this and much more before worrying themselves to death over radiation. Stress related to radiation fear is just as big of a health problem as the radiation itself.
There are three main types of radioactive isotopes released by Fukushima that cause concern, Iodine 131, Cesium 137 and Strontium 90.
Iodine 131 has a half life of about 8 days. The half life, or time it takes for half of the concentration to decay, is short which is good and bad. It is good because after 5 half lives, 40 days, it is pretty much gone. It is bad because it is very active during its biological half life. Biological half life is the time it takes the body to pass half of the concentration.
Each decay is a radioactive pop. In Iodine 131's case the pop is a beta particle or electron with some gamma radiation. Each pop releases a certain amount of energy which is what damages the cells of the body. The beta particle damages cells close to the pop and the gamma rays can travel further. The decay of I131 is in two steps. The first is beta decay to Xenon 131 which then emits gamma radiation. The average total energy of a Iodine 131 pop is 971 KeV 0r 971 thousand electron volts.
The biological half life of I131 is a little tricky. I131 many is absorbed after ingestion by the thyroid gland. If absorbed by the thyroid, its biological half life is longer than it radiative half life. If not absorb by the thyroid the biological half life is shorter. For this reason, the biological half life is not commonly published.
I131 also impacts health oddly. Smaller amounts do more damage than larger in most cases. For these reasons, the relatively short half life, affinity for the thyroid and smaller hazardous dose, Iodine 131 is generally the most dangerous of the radioactive fallout. Large doses of stable Iodine reduce the amount of radioactive iodine that can be absorbed by the thyroid. Because of its short radioactive half life, Iodine 131 is not a long term problem.
Cesium 137 or Caesium 137 has a half life of about 30 years. Unlike Iodine, cesium 137 is chemically similar to potassium and Rubidium. Potassium is a common electrolyte used mainly in the muscles of the body, though some may be absorbed in the bones. Cesium 137 also has a two step decay. Cs137 decay to Barium 137 releasing a beta particle and the barium 137 releases gamma radiation. The total energy released is 1176 KeV of 1176 thousand electron volts. This is a little more energy than the Iodine, but not much. Cesium 137 has a biological half life of 70 days. Prussia Blue is an antidote for Cesium 137. Since the cesium 137 is treated as potassium by the body, maintaining proper electrolyte levels reduces the amount of cesium 137 absorbed.
Strontium 90 has a half life of about 29 years. Strontium 90 is a bone seeker. It is treated like calcium in the body, can cause bone cancer and leukemia. It has a three step decay to Yttrium 90 with a half life of 64 hours and then Zirconium 90 with total beta decay energy of near 2800 KeV or 2800 thousand electron volts. More than twice the decay energy of Iodine 131 or Cesium 137, but second decay to Zirconium 90 has the most energy at 2200 KeV. As a bone seeker, Sr 90's biological half life is indefinite if absorbed by the bones or teeth. 70 to 80 percent of ingested Sr 90 passes quickly through the body without being absorbed. Because of the high energy and absorption in bone and teeth, Sr 90 has a greater probability of causing cancer.
Research by the Radiation and Public Health Project has indicated that Strontium 90 released during nuclear tests and near nuclear reactors has caused elevated concentrations in the public and increased cancer rates. The reports have been criticized by the Nuclear Regulatory Commission and the results available online appear to be inconclusive and poorly compiled. Per the study, approximately 1.6% of the respondents had some form of cancer and the majority of the cases were from 1962 to 1964, dramatically decreasing after 1964. The Wikipedia editor that referenced the report included a link to a New York Times article and not the actual report. Comparing the reported results to the Center for Disease Control National Vital Statistics Summary , there does not appear to be any verification of the reported results.
While Strontium 90 is clearly likely to cause cancer in sufficient dosage, there is no credible evidence that dosage under the regulatory limits of NRC pose any significant increase in cancer risk.
For example, ingesting 100 becquerel equivalent of Sr 90, the body may retain 30 becquerel equivalent or 30 pops per second. The average energy per pop would be 1400 KeV, about 40% greater than the average, so the damage would be roughly equal to 42 pops or counts per second. For an average adult, this is less than 1/1000 of the normal background radiation produced by your own body and a much smaller fraction compared to the total normal background radiation. Since Strontium 90 is a small percentage of the total radiation released at Fukushima, the 100 becquerel example is probably quite high. I will review the reports, but Sr 90 was less than 1 percent of the radioactive isotopes released with 3.2 to 32 becquerel per kilogram found in only a few soil samples.
I will continue after further research to find a more compelling peer reviewed report if one exists.
With nuclear radiation there is a lot of contradictory information available. Like the Strontium study, statistics can be very misleading because of the natural occurrence of cancers that may be linked to man made radiation, but existed naturally before the start of man made atomic fission and increased not because of radiation but improvements in health care, changes in environment and exposure to other non radioactive carcinogens. One major factor that is missing from the more controversial studies is with increased life expectancy, the causes of death change. In the fifth and sixth decade cancer is the more prominent cause of death which is more likely due to hereditary and environmental factors, than man made radiation exposure.
These studies are also complicated by the paradoxical "Vaccine" effect of some low levels of certain types of radiation exposure. Lower levels of Iodine 131 tend to increase thyroid cancers while very low levels of tritium, (the radioactive isotope of hydrogen) tend to reduce thyroid cancers. To attempt to simplify the risk of adverse health impact by exposure to man made radiation, the increase in radioactive decay energy may be a useful tool.
As a general rule of thumb, more rapid decay energy absorption is more detrimental to health. This is far from a perfect rule of thumb as parts of the body respond differently to radiation levels.
Counts or pops per second are the simplest measure decay energy. Isotopes with shorter half lives pop more quickly. Isotopes with half lives shorter than hundreds of thousands of years are generally man made. On average, the human body contains radioactive isotopes that result in 4,400 pops per second per 75 kilograms of mass. The 75 kilograms is considered the average mass of the average human. Since few people are truly average, 60 pops per kilogram or 30 pops per pound are good baseline numbers to use for radioactive health purposes. Depending on environment and lifestyle there can be a significant variation from this baseline per individual. Since hundreds of thousands of people have or plan to buy Geiger counters, don't freak out if your baseline is higher, because the normal background radiation where you live can be much higher than your body mass baseline.
The Becquerel is defined as the decay of one nucleus per second. Because of radioactive potassium 40 producing the pops, the average kilogram of human mass has a Becquerel count of 60 Bq/kg. Animal testing on dogs primarily, have been used to determine the lethal dose for 50% of the population or LD50. A test on Beagles with Cesium Cloride did not publish the LD50, (the paper is behind a pay wall) in its abstract, but the LD50 from the information available is greater than 1900 micro Curries per kilogram. 1900 micro Curries per kilogram is equal to 70.3 million Becquerel per kilogram which is considerably larger than 60 becquerel per kilogram. As an estimate, 1/1000 of 70.3MBq would be 70.3 KBq or 70,300 Becquerel per kilogram which is where possibly a statistically significant adverse health impact could easily be determined.
Beagles are not people and the test was not designed to determine increased incidence of cancers due to radiation. Still, the 70,300 Becquerel per kilogram implies a maximum exposure limit that may possibly not cause adverse health impact, but probably a measurable health impact. Definitely a when to be worried point.
Studies of Chernobyl offer more information on direct human impacts of radioactive Cesium. Studies by the former Soviet Union Government are appropriately questionable. Studies by international agencies are much more likely to be trust worthy, though they may tend to be overly critical in some cases due to legal and political issues. The most likely studies to be overly critical are studies using linear no thresh hold models. These models easily confuse normal mortality rates with possible radiation impacts. Political influence may have caused lower impact estimates by international agencies with interests in nuclear power. It is a tangled mess, but there are still some reasonable conclusions that can be drawn, if you wish to be unbiased.
First, studies of the individuals actively involved in the containment of the incident provide a reasonable maximum impact. While criticized by anti-nuclear advocates, The WHO reports indicates that approximately 9000 excess cancer deaths for a population 600,000 exposed to the highest radiation levels of approximately 40,000 Becquerel per meter squared. This estimate includes iodine 131 death rates which are extremely high due to poor emergency procedures employed by the former Soviet Union and somewhat surprisingly France. It also includes emergency workers exposed to much higher direct radiation levels. It should be noted that direct exposure caused fewer deaths than ingestion of radioactive isotopes.
Second, countries near the Chernobyl site conducted individual studies and established maximum safe radiation levels for food products. The EU for example has a 600 Becquerel per kilogram limit on food products. The UK placed a limit of 1000 Becquerel per kilogram on sheep meat. Wild game, boar in particular, were found to have levels up to 40,000 Becquerel per kilogram with an average of 6800 becquerel per kilogram. The EU and UK limits were established where there is no statistically significant cancer risk. There is a gray area between the safe limit for humans at ~1000 Becquerel per kilogram and animal limits of approximately 40,000 to 70,300 Becquerel per kilogram.
While animals are not people, the food limits that apply to meats is an indication the human radiation levels can be considerably higher than the average 60 pops per kilogram and still be safe.
Where to draw the concern line is a personal decision. Twice average should not be a level of concern, but ten times average may be. The type of isotope needs to be considered, Iodine 131 because it is thyroid specific. Strontium 90 because it is bone specific and higher energy. There is no indication though that limits set by nations for food stuffs and water supplies pose any significant health risk.
If you happen to be the proud new owner of a Geiger counter, you may wish to establish your own body mass baseline. If you properly allow for background radiation, 60 pops per second/kg is perfectly normal. 120 pops per second/kg is very likely to be safe. 360 pops per second/kg may be your concern thresh hold. With 600 to 1000 pops per second/kg a definite level of concern. Remember that background levels are not only higher, they can be variable. Your fancy new Geiger counter may not have the sensitivity to do anything but scare you or give you a false sense of security. If it provides you some piece of mind, read up on the limitations of your Geiger counter to avoid freaking yourself and others out with erroneous readings and interpretations. If you are confident in your ability to properly use your new Geiger counter, think about publishing your results, including methods, online. Note: I dropped a sentence, Trying to measure your body mass radiation level with a Geiger counter will not give you a number to be confident in, properly calibrated it can give you an indication of change in radiation level, like testing food.
After Thoughts:
"The report said cancer risk from exposure to between 100 and 200 millisieverts is 1.08 times higher when compared with people who weren't exposed, while the cancer risk of people whose body mass index was between 30 to 39.9 was 1.22 times higher than a group of people whose body mass index was between 23 and 24.9. The cancer risk was 1.6 times higher for a group of people who smoke, when compared with nonsmokers, it said.
"The risk of cancer incidence is not zero even at low doses. . . . But the levels we are now exposed to are not something people have to worry deeply about," said Ikuro Anzai, a professor emeritus at Ritsumeikan University who has criticized the safety of nuclear power plants for decades.
"Many people get scared simply by hearing the word radioactivity. But we have to base our worries on reality. It is very difficult, but we need to have rational fears," said Anzai, an expert on radiation protection." I found this published in the Japan Times after I posted this. It is excellent and by someone with anti-nuclear leanings.
Still, the units used to describe radiation levels are confusing. That is the main reason I put this together using the Becquerel/kilogram or counts per second which most of the Geiger counter buyers will have as a reading. As I have mentioned in other posts, there is no direct conversion from Becquerels to millisieverts, though ingested radiation allows a somewhat reasonable comparison. A millisievert is a small unit and a becquerel is a very small unit, so don't confuse them, stress can be pretty bad for your health too.
Monday, May 30, 2011
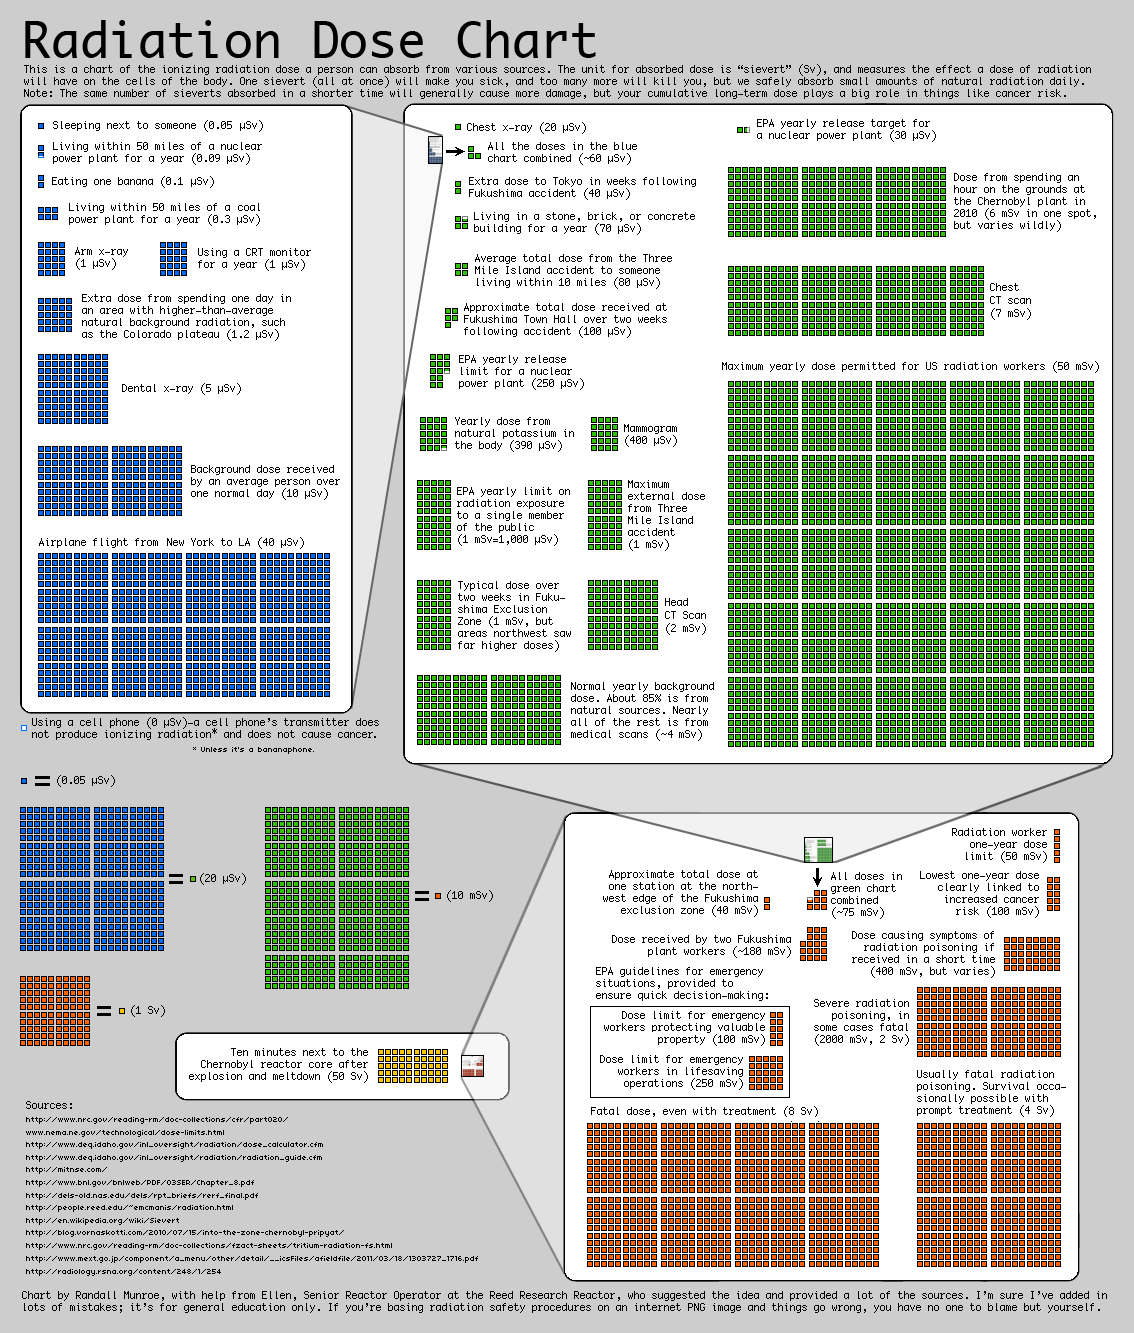
Incorrectly Correcting the Banana Equivalent Dose
Wikipedia is a living encyclopedia that changes with global events. The Banana Equivalent Dose entry has been corrected since the Fukushima incident, but was it really corrected?
History
The banana equivalent dose was introduced as a way to clarify the risk of radiation exposure that results from human activity, such as the use of nuclear power or medical procedures, by comparing it with the risk associated with natural doses. The BED calculation probably originated on a nuclear safety mailing list in 1995, where a value of 9.82×10⁻⁸ sieverts or about 0.1 μSv was suggested.[1] However, that calculation has been criticized as misleading,[2] since excess potassium ingested (in the form of a banana) is quickly eliminated by the body.
In 2011, as the Fukushima nuclear disaster unfolded, the idea was popularised on xkcd[3] and slashdot.[4]
From this change it would seem that the BED is misleading, but the implication that the BED is misleading is more misleading than the original use of the BED.
The editor of the article implies that since the body constantly cycles potassium that the level of radioactive potassium 40 would remain constant and that other sources of radiation would not. While different types of radioactive isotopes do effect the body differently, the revision trivializes BED by not going into depth as to were it is effective and ineffective. Indicating that the editor may be emotionally or politically motivated.
One of the primary radioactive isotopes of concern following Fukushima is Cesium 137 contaminating food. Cesium 137 is chemically similar to potassium and like potassium also passes through the body. There are differences in the way Cs 137 and K40 react in the body. K40 has a half life of 1.3 billion years versus Cs137 with a half life of 30.7 years. Since Cs137 has a shorter half life, it tends to "pop" or have counts per second more often, so a smaller quantity of Cs137 produces the same quantity of radiation as a much larger quantity of K 40. However, the radiation concentration is based on "pops" so the health impact of Cs137 is virtually identical to potassium 40 at the same level of radiation. The editor's logic falls apart by assuming an atom for atom equivalent instead of a count per second equivalent. Based on count per count, the probability that a greater quantity of Cs137 will be absorbed than K40 is unlikely. The excess of each would be equally likely to pass through the body.
In the case of radioactive iodine, the BED dose needs to be qualified. Unlike potassium, iodine has a more limited role in the human body. Iodine is preferentially concentrated in the thyroid and low doses of radioactive iodine 131 are paradoxically more dangerous than high doses.
Like Iodine 131, where stable iodine reduces the absorption of radiation in the thyroid by filling iodine receptors, maintaining proper electrolyte levels reduces the absorption of Cesium 137 in the body.
With the exception of radioactive isotopes that have a greater tendency to accumulate in certain organs or glands, the impact per "pop" or count varies little in the human body. The Banana Equivalent Dose is an effective method of communicating radiation impact with limited qualifications.
It will be interesting to see if the Wikipedia Banana Equivalent Dose editor can revise his revision with a little more concrete wording and citations.
Sunday, May 29, 2011
The Fallout Over Moving the Radiation Goal Post - Japan's Radiation Issues
The Japan Probe website has a new post on the changing maximum radiation limits in Japan. "Several weeks ago, the Japanese government raised the acceptable maximum annual radiation dosage standard for children from 1 millisieverts to 20 millisieverts (about 3.8 microsieverts a day). The decision outraged many parents, who feared that the new standard meant that their children would be exposed to unhealthy levels of radiation. The Education Ministry initially responded by stating that there was non intention to allow 20 millisieverts of exposure, and that it actually expected that exposure to children would not exceed 10 millisieverts of radiation a year."
In past posts here, I have mentioned this problem and the need for more realistic standards for radiation. Despite what anti-nuclear groups say, there is solid scientific evidence that low dosages of ionizing radiation are not harmful. I have even given reasonable standards based on areas of the world with much higher background radiation and limits that are applicable to workers in nuclear technologies. Thanks to science fiction, uneducated anti-nuclear activists and government agencies of questionable competence, there will continue to be needless confusion on what is allowable without detectable increase in health risk.
"Although radiation may cause cancers at high doses and high dose rates, currently there are no data to establish unequivocally the occurrence of cancer following exposure to low doses and dose rates – below about 10,000 mrem (100 mSv). Those people living in areas having high levels of background radiation – above 1,000 mrem (10 mSv) per year – such as Denver, Colorado, have shown no adverse biological effects." The above is taken from the US Nuclear Regulatory Commission radiation fact sheet. Ten milliSieverts per year is 2.7 MicroSieverts per day or 0.114 microSieverts per hour.
In the same face sheet, the average US background radiation is 310 millirem per year or 3.1 milliseiverts per year or 0.85 microseiverts per days or 0.04 microseiverts per hour. Now for school children in Fukushima the goal is 1 milliseivert per year, 0.27 microseiverts per day or 0.01 microseiverts per hour.
Explaining the real impact of radiation to parents, after a nuclear accident, is not something I envy. But if the Japanese can reduce radiation exposure in Fukushima Prefecture to 1 tenth the background of Denver, Colorado and less than one third the normal background radiation in the United States, more power to them.
The Japan Times had the same story. Between the two sources there appears to be some confusion. By using 1 millisievert per year the Japanese nuclear regulators appears to be sticking with the US NRC guideline of 1 millisievert per year over normal background. Perfectly reasonable under most situation, but a bit overly conservative for Fukushima Prefecture. Their proposed target of 10 mSv per year is much more realistic and proven safe by studies of Denver, Colorado.
For concerned parents, the 20 mSv per year upper limit may be high from a comfort level view, but there is no indication that it is unsafe. Adult nuclear energy works have a 50 mSv per year limit with no ill effects and less than half that limit should not pose a problem for children. The only question really for children is infants, which have not been a large test group for obvious reasons.
Potatoes from Japan are in the news with low levels of radiation. The difference in radiation standards will continue to rear its ugly hear. In the Thai article, sweet potatoes were test at nearly 16 Becquerel per kilogram which is well be low the Thai limit of 100 Bq/kg. Japan has a limit of 500 Bq/kg for most produce. The arbitrary limits varying between nations should be realistically addressed.
While Bananas and Brazil nuts are fairly commonly known to have radiation levels, potatoes are also a background radiation contributor, with levels of 125 Bq/kg not uncommon. Hypersensitivity to radiation after an incident is common and can only be combated with education before an incident. Now Thailand is planning to destroy perfectly safe sweet potatoes once they determine a safe means to destroy a safe food. Yes, it is a little stupid, but every nation has to deal with their lack of proper standards and public trust.
The new tuber terror has spurred the media to look up reports on the potential for potatoes to absorb radiation as they grow. None of the reports I have seen mention that adding potassium fertilizer to the soil decreases the amount of radioactive Cesium 137 the potatoes absorb, much like iodine tables reduce the human bodies absorption of radioactive iodine.
It would nice if some trusted, if there is one, government agency published the average radiation levels of foods and recommended radiation limits so more countries could get on the same page.
Saturday, May 28, 2011
The Sky Has a Temperature!
While many on the web are discussing the boring legalities of scientific endeavor, I have been pondering the humorous contradictions facing certain political activists and how best to explain the greenhouse effect.
One of the better explanations is on Science of Doom in twelve plus parts. While the blogger does an excellent job, I have to admit I have dozed off a few times and found what I was awake for maybe a little complex for the average reader.
Many people still find it difficult to understand how a small trace of carbon dioxide, 390 parts per million, could change climate. It is a matter of scale which I have pounded on from time to time. So since I really don't want to work on the motorhome on this beautiful weekend, explaining climate change sounds like a good diversion. The sky has a temperature. There how was that? Maybe a little more detail huh?
Well, I can expand a bit, but that is the main point. Considering only the night sky, the sky has a temperature and the reason it has a temperature is that the gases that make up the atmosphere have a temperature. For about 20 bucks you can buy a cheap non-contact thermometer and check it out for yourself. The non-contact thermometer is an infrared temperature sensor. It determines temperature based on infrared radiation intensity. Just point it at the sky, pull the trigger and you get a temperature reading. On a cloudy night it is easy to see that the clouds are warmer than the clear sky patches. Depending on how good the thermometer is and how clear the sky is you get pretty big temperature differences.
Down here in the humid tropics, the clear sky may be -40 degrees and the clouds -10 degrees. It doesn't matter if the temperature is in C or F because the accuracy of the cheap non-contact thermometer is not all that great anyway. You will measure a difference though.
What throws most people off is that they can see clouds and they don't see anything in the clear sky. That clear sky is the important part though, even at -40 degrees it has a temperature much greater than the empty space beyond it.
The carbon dioxide is a fairly well mixed gas. Water vapor is not so well mixed. So while water vapor may make up as much as 4% of the local atmosphere, in a clear, dry sky is makes up much less, say 0.5 percent. 390 parts per million, 0.000390, is a small number, but then so is 0.5% or 0.005. At this water vapor concentration, CO2 makes up 7.8% of the greenhouse gas in the sky neglecting the other more rare greenhouse gases. As far as our matter of scale, 7.8% is significant. To simplify things, whenever CO2 has an impact of greater than 1% of the total greenhouse gases, it is significant.
Back at the start of the 20th century, CO2 was about 280 parts per million, so under these same conditions, CO2 would have been about 5.6% of the greenhouse gas concentration in a 0.5 percent water vapor sky. As long as there are greenhouse gases in the atmosphere the sky will have a temperature greater than it would if they were not there.
If there were no greenhouse gases, the temperature of the sky would be about 33 degrees C lower. That is not a hard and fast number. It would vary depending on the initial temperature of the surface under that portion of the sky and the thermal mass of the surface. Water has a high thermal mass, so it takes longer to heat and cool, so it would be warmer if the sky is over the ocean than over a sandy desert for example. Then since the ocean is water, there would be water vapor which is a greenhouse gas, so the 33 degree number is more of a concept than a real situation.
Understanding why the 33 degree number is a concept is kind of important. As long as there is water on the planet there will be water vapor. Water vapor is the dominate greenhouse gas because of the amount of water on the planet, so CO2 plays a limited role in limited regions of the atmosphere. The drier the air, the greater its role.
The physics behind the greenhouse effect is really not that complicated. The shape of the greenhouse gases molecules is different than the other diatomic gas molecules in the atmosphere. N2 nitrogen, O2 oxygen make up nearly 99 percent of the atmosphere. All the trace greenhouse gases have more than two atoms per molecule. Since the greenhouse gas molecules are not symmetrical, they behave differently when excited than the diatomic molecules. They are excited by infrared heat or radiation, while the diatomic molecule not so much. Once excited by infrared or collisions with other molecules, they gain heat energy which they can pass along to any other molecule or lose to space. The closer they are to the surface when excited the more heat the surface can retain. If the greenhouse gases molecules are high in the atmosphere, heat is retained, but has less impact on the surface.
Some will have a problem with my word "retained". I like it because retained does not have a fixed time associated with it. You can retain your earnings for a long time or spend it quickly, but it was still retained because you had the option to use it. Once you understand that greenhouse gases help retain heat, you can look at the significance of scale of the individual greenhouse gases to understand the relative impact they have.
It is pretty easy to understand that the higher the sky's temperature the more heat is retained, the warmer the surface can be. If you set a cold beer on a picnic table in the winter is will stay cold longer than it would in the summer. If you are not into beer, you could used a cup of hot coffee, which would stay hot longer in the summer than it would in the winter. The rate of heat flow depends on the temperature difference. If the sky is colder, the surface gets colder faster than when the sky is warmer. Heat flows from hot to cold and flows faster the bigger the difference between the hot and the cold.
The greenhouse effect is not rocket science, it should be easier for most to understand if people explaining it would stick to the basics and matters of scale.
Explaining how much an increase from 280 parts per million to 390 or 560 parts per million will increase the sky's temperature is a touch more complicated.
Friday, May 27, 2011
Fonda versus Nadar - Clash of the Liberal Icons
What makes people tick interests me. Liberals in the United States are big hearted, good natured and totally gullible. Penn and Teller had fun with the environmentalists years ago with the Di-Hydrogen Monoxide skit.
Recently, Ralph Nadar has published a list of the top 12 cancer-causing products in your home. Crystalline Silica, sand, is one of the prominent carcinogens included in the dangerous products. This is leading to a confusing situation for loyal liberals. Liberal Icon, Jane Fonda is a commercial spokesperson for L'Oreal cosmetics. One of the many carcinogenic ingredients in L'Oreal products is silica. What's a liberal to do?
"Lanolin Oil , Sesame Seed Oil , Oleyl Erucate , Microcrystalline Wax , PPG-5 Lanolin Wax , Acetylated Lanolin , Beeswax , Disteardimonium Hectorite , Fragrance , Tocopheryl Acetate , Rosa Canina Fruit Oil , Arginine PCA , Jojoba Seed Oil , Benzyl Alcohol , Silica , BHT , BHA , Calcium Sodium Borosilicate , Calcium Aluminum Borosilicate , Synthetic Fluorphlogopite , Polyethylene Terephthalate , Polymethyl Methacrylate , Iron Oxides CI 77492-CI 77499-CI 77491 , Mica , Titanium Dioxide CI 77891 , Red 7 CI 15850 , Red 28 Lake CI 45410 , Yellow 6 Lake CI 15985 , Carmine CI 75470 , Red 22 Lake CI 45380 , Yellow 5 Lake CI 19140 , Blue 1 Lake CI 42090 "
This list of ingredients for Hip lip stick is fortunately not easily accessible for most liberal, female consumers. If it were, the sassy, sexy liberal spokes model would be a thing of the past.
Thursday, May 26, 2011
The Price of Fame - The New Legalities of Science
Scientists publish papers all the time, that's their job, publish or perish. Ground breaking papers published in big name journal rarely are really ground breaking. Most have some flaw that under more scrutiny is revealed that may lead to something or may not. If the work appears to be truly ground breaking, the scientist or team receive notoriety. If the paper is perceived to be ground breaking, touted as a new revelation, then found to be flawed, the fun begins.
The price, especially when the scientist or his work may sway policy, is law suits. There are a lot of law suits flying around in climate change right now. Many of the scientists involved are not accustom to the reality of fame, so their learning is entertaining and often very funny.
Micheal Mann, of IPCC "Hockey Stick" fame is currently center stage. He now works at the Penn State University. Most sports fans know the old Penn State, State Pen joke. Mann has a pending law suit with a Canadian over his character being defamed because of that joke. Mann also worked at the University of Virginia which is now being taken to court to release internal documents and e-mails related to Mann requested under the Freedom of Information Act.
A report critical of Mann's methods was withdrawn due to plagiarism. This report was authored by a student of a Doctor Wedgman who testified before the US Congress that the Mann "Hockey Stick" was flawed and the peer review process tainted by the limited number of experts in the field for reviewers. "Pal Review", as it has come to be known is letting less than stellar work slip through to the big name publications. That is the allegation anyway.
So now the internet is really buzzing with various blogs taking up positions. I have written my own opinion on the poor statistical choices of Dr. Mann. To error is human, so I am not one to kick a Mann down, but Mann is a serial offender. His confidence in his novel statistical insight is surprisingly intact despite many reminders that his conclusions are not very skillful. It is Mann's poor choices that have lead to calls for all climate science publication to be reviewed by third party statisticians.
Oddly, a great deal of climate scientists publicly defend Mann's less than stellar work. This is opening a huge can of worms.
Everyone knows that public officials have less protection from defamation laws in most countries, especially the United States. Public figures have more legal protection until they attempt to influence policy, which makes them legally on par with public officials. So the whole defamation games changes.
One of the liberal bloggers, Deep Climate, pressed hard to discredit the paper on Micheal Mann's "pal Review" process. The plagiarism issue championed by the liberal climate science community now opens the door wider to scrutinize their ethics. Tit for tat. One example of obvious plagiarism by the liberal side is the Menne et al paper that stole the work in progress of conservative blogger Anthony Watts. Watts and Menne came to an agreement so that the stole work was property attributed after the fact. While Watts may be satisfied, the plagiarism by employees of the United States Government of a private turned public citizen can lead to the mother of all federal cases. Menne et al committed a crime. Not a devastating crime, one that would not even require a written reprimand. However, the potential conspiracy to commit even a minor crime could be a much greater crime. "Pal Review" can easily become conspiracy which can be an extremely nasty legal situation.
Micheal Mann's poor statistical choices, since they were repeated in his following works and a co-authored paper with Dr. Eric Stieg, could be considered a conspiracy to improperly influence public policy. By gaining the level of fame they have and attempting to sway policy, their lives are no longer private.
So I predict, that the scat has not finished hitting the fan. No matter their intentions, quite a few climate scientists are about to enter the litigation zone.
Wednesday, May 25, 2011
Cooling Pipe Breach Possibly Caused by Earthquake - Fukushima
The Japan Times has an article reporting that TEPCO is now saying the Cooling Pipe Breach Now Laid on Tremblor. I doubted that the meltdown caused a penetration in the reactor pressure vessels, this makes more sense, but still could use a little more detail.
The Japan Times is an English speaking newspaper/website with news from Japan. I don't peak Japanese, so I have to rely on such sources, but cannot be sure of their accuracy.
Since the reactor was not quite designed for the magnitude of the mega earthquake, it is possible that the seismic force damaged the cooling pipes. Piping design for earthquake conditions is pretty good, so I still have some doubts. While the article mentions that overheating aggravated the situation and enlarged the leak, the timing leads me to believe that thermal shock, the over heating then inadequate cooling, may have been the major cause. Of course I cannot know for sure and there are plenty of experts out there, but things are starting to make more sense.
The leak may complicate TEPCO's plans for cold shut down, but since they already knew there was a leak, I doubt it will overly complicate things. It will make it more difficult to bring the other undamaged reactors back online, but that is not a practical idea under the circumstances anyway.
If the damage was indeed due to the earthquake, then the status of the other Japanese reactors does not look good. Since it may take years to determine exactly what happened, it is unlikely that the older reactors in Japan will be operated any time soon due to concerns of another megaquake. That is one of the odd things about human logic. Megaquakes relieve a great deal of pressure reducing the odds of a new earthquake of that magnitude in the same general area for many decades. Shutting down the other reactors for fear of another major earthquake now is like closing the door after the horse has run off then burning down the barn because it let the horse out.
Monday, May 23, 2011
Irradiated Food - What's the Fuss?
Following the situation in Japan I have run across a few cultural curiosities. Japanese culture is steeped in tradition, but it ain't my tradition so I find somethings odd as all hell. I love Japanese food, but some things I do not even think of trying. Natto is one. It is fermented soya beans. It smells like toe jam. I love blue cheese. It doesn't smell much better to the average Japanese. So I guess that is a draw.
Raw beef?. Hey, I happen to like some beef raw, but I make it myself just to make sure I don't get sick. The Japanese are pretty partial to raw beef also. A few people died in Japan recently due to bad raw beef in a restaurant. It is a price too high to pay for good eats.
Today is much different than when I was a kid. We had real neighborhood butchers and locally raised meats and vegetables. You hardly ever heard of someone getting food poisoning. Today with everything mass processed and brought in from who knows where, all too often something is in the news about food contamination. It is a problem that doesn't need to be a problem.
Irradiated foods, foods treated with ionizing radiation, have very little chance of causing most common food poisonings. The radiation treatment prolongs shelf life, keeps natural food coloring and best of all, allow you to safely have hamburgers medium rare without having to grind the beef yourself. Only one problem. I can't get it because people would rather die than eat something they think may be bad for them.
There are a lot of very smart sounding people that claim irradiated foods are a cop out. That they have a better way, grass feed, free range, organic... Other than grow it yourself, as in me (I don't trust a lot of people that think they know how to farm) there is not much you can do, other than irradiation.
Organic is great. I steal stuff from my neighbors organic garden all the time. Personally, I know that used properly, there are excellent fertilizers and even pesticides (gasp) that help grow perfectly healthy foods. The rub is only certain things grow at certain times of the year. Also, I found out that my neighbors were not all that thrilled with me free ranging my chickens. I even had brown eggs beat, my hens laid pastel green eggs. The fresh eggs were great though and chickens will keep a yard nearly bug free. Little piles of yet to be composted chicken matter was a little problematic.
My good ol' days have past. Now I have to deal with someone else's good ol' days which unfortunately includes Salmonella, E. Coli and soon to be named other weird nasty junk. Why not cut me a little slack and at least read about irradiated foods written by someone that actually knows about irradiated foods? If you are capable of being open minded, you might find the objections humorous.
Radiation Safety Levels - The Moving Target
I have been curious about nuclear power and its potential problems for a long time. In the early days of the atom, it was touted as the new miracle energy that would put everyone on easy street. As with most things so new and wonderful, I have grown to have my doubts, not only about the wonderful promises of life changing improvements, but the doom of life changing disasters.
If a little is good, a lot has to be great, seems to be the cause of most of man kinds problems. Things that are used as directed tend to be fine in most cases, it is when we use too much of a good thing we get in trouble. That seems to be the main problem with nuclear energy.
Nuclear is scary and expensive. Because of that, governments and utilities try to cram too much in small spaces to compromise the fear and cost factors. Then if something goes wrong any is too much. Maybe people will never understand to read directions before use.
Since the situation in Fukushima started, I have spent more time than I should trying to put things in perspective. The nuclear problem is mainly due to trying to get too much out of the Fukushima power plant. At the time the plants were built, they produced huge amounts of energy for the time, with not a great deal of efficiency. The fuel when Fukushima was first built was fairly inexpensive for the time, the safety requirements were the main cost. The game plan to build bigger may have sounded great, but was not all that bright. Then to try to get the plants to produce as long as possible was not too bright either. This is not just a Japanese thing.
Too big is the main problem. While the technology of nuclear power in not difficult to understand in today's world, we still seem to be befuddled by it. More nuclear fuel takes longer to shut down than less. There are pretty simple calculation that you can make to see how much trouble you want to deal with in controlling nuclear power. In the old style reactors, the gross energy is three times the net energy produced. The emergency shut down energy is 7% of the gross and decreases rapidly to 1.5% of the gross over the next 24 hours. To safely shutdown a reactor you have to be able to deal with the 7% quickly and the 1.5% as it decreases for a long time. If you can't deal with it, then there will be a big loss of investment. You have trashed an expensive investment, loss a large portion of you electrical base load, scared the hell out of millions of people and have to pay damages to all the people that have had to change their daily lives to accommodate your screw up. To reduce the impact once the mega plant has been built, you have to use what the design and situation allows to control the damage.
The Japanese dealt with Fukushima as best they could under the conditions. Most people have great hind sight, so it is easy for folks sitting a home to point out all the things that could have been do better. Many say the best solution was to not get into that situation to begin with. I am not particularly better than most at arm chair quarterbacking, but there are a few things I think I have learned from Fukushima.
The first thing I notice is that the older the plant, the more you have to plan for things going wrong. Planning for each and every thing that happened is close to impossible. You can plan for the absolute worst case. That would be that the plant never shutdown and there was no water, no load, no nothing to stop things from going bad.
In a worst case, the worst thing is having to evacuate a sizable population. The area to be evacuated is dependent on the potential amount and spread of radiation. No matter how well the nuclear plant is designed, the potential fallout is has to be considered. Twenty to thirty kilometers is normal for a nuclear power plant of Fukushima's size. That area appears to be based on the size of the individual reactors not the total number of reactors. It takes energy to spread enough radiation and it is the individual reactor energy that would determine the average potential radiation spread. There reactors may spread more radiation, but the distance would be close to the same as the single largest reactor. In terms of human lives and livelihood, the most pressing safety concern, that evacuation area should be minimized.
Time and money can solve most any problem related to a nuclear power plant accident, except for the human element. Smaller individual reactors even with many more installed on a site, reduces the potential impact on lives.
Better understanding of the impact of radiation fallout can also reduce the evacuation area. I have noticed that I am not a part of as small a group as I was ten years ago. Advances in nuclear medicine have educated many more people to the truth of radiation. While it is still dangerous, the human body can tolerate a lot more than previously thought. We have even learned over the past 30 years that every day we are exposed to more naturally than we would have ever imagined. While many radioactive isotopes are no longer common in nature, they have similar isot0pes that are and we are continuously exposed to in varying amounts.
Most of my curiosity about radiation started years ago with the "discovery" of radon levels in homes. I used to test indoor air quality and I avoided jumping on the radon testing bandwagon. The health impact of low levels of radon were nothing compared to common molds. Water in homes where water is not supposed to be, is the primary cause of indoor air pollution followed by out gassing of volatile organic compounds. Knowing this, I have little problem living near a nuclear power plant but would be adamantly opposed to living near a chemical plant. I would have days or weeks to evacuate from a nuclear incident, but could be dead before the alarms sounded if I lived in Bopal, India, for example. Long term exposure to low levels of toxic chemical can have a much more devastating impact than low levels of radiation.
Safe use of nuclear energy demands knowing the potential for harmful levels of fallout in a worse case and understanding what levels are truly harmful. The first is known and can be reduced. The second is the bugger. Japan made a mistake by not establishing more realistic standards of harmful radiation levels. They had to revise maximum levels from their unrealistic standards to more realistic levels while a nuclear situation was in progress. That creates mistrust and that trust may never be regained.
The US Environmental Protection Agency is on the same poor path. They are imposing irresponsible maximum standards that are fractions of the standard guidelines of the US Nuclear Regulatory Commission which are themselves very conservative. For example, the Yucca Mountain National nuclear waste storage facility has EPA limits of 15 Millirem per year above background. 15 millirem per year is 1.7 microrem per hour equivalent to 17 nanosieverts per hour or 0.017 microsieverts per hour. One thousand times that, 1.7 microsieverts per hour, or 14.9 millisieverts per year is about one quarter the radiation exposure limit for people employed in nuclear medicine. With the EPA standard, people living in the area are exposed to more radiation if they have two smoke detectors in their homes (37 kiloBecquerel per detector). Think about that. 37,000 Becquerel per smoke detector. Of course, Becquerel is not directly convertible to Sieverts unless ingested, still it is an illuminating comparison.
Radiation is a part of our lives, isn't it time to start trying to better understand it?
Saturday, May 21, 2011
Japan's Radioactive Tea
A type of tea in Japan has been found to be contaminated with Cesium 137. The Japanese governments limit for radiation of the tea is 500 Becquerels per kilogram. Since tea is pretty important in Japanese culture, some citizens are wondering if the limit is really needed. The Japan Probe post on Radioactive Tea in Japan gives a good account of the situation. One of the main issues is tea is dried, steeped then drank, but the Japanese regulation is for un-dried tea like it is a vegetable to be eaten.
The unit Becquerel means one disintegration per second. In the USA we use the unit Curries were one Currie is equal to 37 million disintegrations per second. A disintegration is a pop or count on a Geiger counter. For the average tea drinker this is pretty scary and most have know clue it the tea is really bad for them since they have know clue what a Becquerel means health wise.
The Nuclear Regulatory Commission in the United States came up with the Banana Dose to help people understand radiation. The Banana Dose (BD) is considered to be 520 picocurries. Using a handy dandy converter a BD is 19 Becquerels. So 500 Bequerels is a bunch of bananas. Since most people don't eat tea fresh, it is dried first which decreases its weight which would increase the radiation per weight. But only a small amount of dried tea leaves are used at a time and not all the radiation may be dissolved in the tea after steeping. Interesting puzzle.
After drying, tea weighs about 15% of what it did straight off the tree. So a kilogram of dried tea that tested at 500 becquerel per kilogram fresh, would test roughly 3333 becquerel per kilogram dried. The average strong tea bag contains roughly 3.3 grams per Wikipedia, so a mug of radioactive tea would contain about 11 Becquerels. What I am calling a mug is about 1/4 liter. So one liter of radioactive tea would be about 44 Becquerels worth of radiation, if all of the radiation in the tea leaves dissolved in the water. For infants, the Japanese limit per liter of water for radiation is 100 becquerels and adults 300. So at first blush, it does not look like the 500 Becquerel limit for fresh tea leaves is all that reasonable. One thousand Becquerels per kilogram of fresh tea would bring the per liter of consumed tea to 88 Becquerels, which should be safe even for infants if it were water, milk, juices or any other liquid.
I just used rough numbers, but it looks like the tea should be pretty safe. Since the 100 Becquerel limit is very conservative to begin with, I am pretty sure it is safe at 1000 Becquerels per kilogram of fresh tea leaves. I would think the Japanese government would test the tea as it is used before setting a weird limit on a product unless there is a common food use for fresh tea leaves. It would also be nice if they used the banana dose equivalent more when describing the safety of food stuffs.
It would also be interesting to know if vegetables were tested after rinsing. Most radioactive isotopes wash into the soil. Some are taken in by growing plants, but the majority remains in the soil. Cesium is absorb in the human body similarly to potassium. According some of the sources I have read, most of the cesium ingested passes through the body in about 100 days. Since it is chemically similar to potassium and sodium, that makes sense, but more could be retained.
While Fukushima is a dangerous mess, there is plenty to be learned from the misfortune of the Japanese people. Hopefully, a better understanding of ionizing radiation will be one of the lessons learned.
Thursday, May 19, 2011
Climate Predictions and Data Accuracy
There is a lot of debate about how good the data is that is used to predict global warming. Fall et. al. has a paper out about the US surface stations, Tisdale and Tamino are battling over the Ocean Heat content, the models used are constantly challenged by skeptics, all this just leads to more disagreement between the players and the numbers. When I see this much noise, both in the data and the argument, my normal conclusion is the answer is near the middle.
My simple (crude if you prefer) look at things is just my way to get a handle on things. It is based on economic bubbles.
We have had quite a few economic bubbles. No one seems to see them coming until they arrive. I have used longer term moving averages for a long time to get a handle on the economy. A five, ten or larger number of year average gives you a simple measure. If what you are betting on is above the average, it is likely to correct to below the average. The more above, the more likely the correction will be sever. It works pretty good for economic trends. Climate is different because the data is not all that great.
This is not a dig on the guys collecting the data it is just the nature of the beast. The ocean heat content is a great example. OHC depends on a lot more than surface temperature. There is a lot more going on below the surface. To confound things, it takes a very small change in temperature below the surface to have a fairly large change in OHC. The way the data for OHC has been collected changes over time. Most are biases to the surface temperature. More recently, the upper 2000 meters have been included. There is nothing simple about interpolating the older data to the newer data. The OHC therefore sucks, but that is just the way things are. So Tamino lambasting Tisdale for "Cherry Picking" what appears to be the best data is kinda funny to me.
So I started playing with some moving averages. I compared a 21 year backward looking moving average of the Hadcru data with an 11 year moving average. I could have used different time frames, I just happened to used these. While it is not very scientific, I expect the slope of these different moving average to be similar and that the R squared value of the longer moving average to be higher than the shorter moving average. The longer term is more smoothed, so there is less variation.
I also added the Dora Total Solar Irradiance (TSI) to this chart just for grins. I had to scale the TSI and the OHC data for the view I wanted. The yellow (21yma) and green (11yma) for the HADCRU are the only two I think are worth comparing since the time periods are much shorter for the other two. The scale of the Dora exaggerates the energy of the solar as directly measured, but is roughly what the impact some believe it would be with amplification of other natural factors. The correlation with solar is pretty minimal. It probably has some cyclic impact on surface temperature, but it would be pretty complicated to prove it has a significant impact (Maximum Overlap Discrete Wavelet Transform?). The 11 year moving average of the OHC shows pretty weird stuff at the start when the data is the poorest. I personally doubt there is a 10 year lag in OHC of that magnitude. I believe the data quality leaves a bit to be desired.

In this chart I dropped the Dora and chopped off the HADCRU to start with the OHC. The slope of the HADCRU moving averages changed as would be expected, but the R squared and relative slopes changed. To me this is an indication that the earlier data quality is not the same as the later data quality. There are larger adjustments made to the earlier data plus other factors. This doesn't indicate which is better or how much better (worse), just that there seems to be a difference.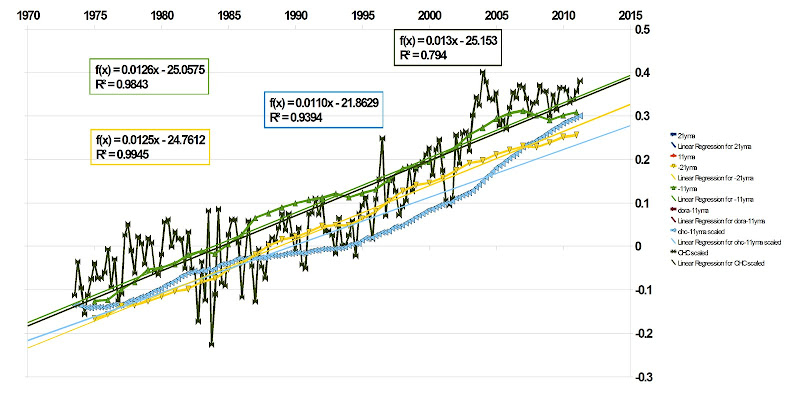
In this chart I chopped off the weird start of the OHC and the HADCRU to match. I also added the OHC quarterly data with trend. Even with the shorter time period the agreement improves between all four plots. To me this indicates an improvement in the data quality. The start time happens to be around the time that more work was started to analyze anthropogenic impact on climate.
Comparing the charts just states the obvious, the quality of measurements improve with time. So to me "cherry picking" better data is not only okay, but required if you want to learn more about things. I don't see why there is so much squawking about cherry picking if done properly.
I am curious about the 1910 to 1940 surface temperature data. Allowing for uncertainty in the data quality of the 1910 to 1940 versus the 1980 to 2010 period, there are probably clues in the comparison.
There are a good many clues that may be lost in the ridged treatment and selection of different data sets. Paleoclimate data series tend to be overly smoothed trying to dig out whatever signal there may be. "Regional" climate impacts in the past are smothered by the signal processing and weighting of series. In general, I feel that many scientists are overly confident in their results. This makes them overly sensitive to what should be constructive criticism and questions they feel they have adequately answered with older analysis. As the data improves the projections improve. More scientists should update their analysis online so we all can get a better view of the changing picture.
BTW: My methods may be crap, but the charts are looking better :)
My simple (crude if you prefer) look at things is just my way to get a handle on things. It is based on economic bubbles.
We have had quite a few economic bubbles. No one seems to see them coming until they arrive. I have used longer term moving averages for a long time to get a handle on the economy. A five, ten or larger number of year average gives you a simple measure. If what you are betting on is above the average, it is likely to correct to below the average. The more above, the more likely the correction will be sever. It works pretty good for economic trends. Climate is different because the data is not all that great.
This is not a dig on the guys collecting the data it is just the nature of the beast. The ocean heat content is a great example. OHC depends on a lot more than surface temperature. There is a lot more going on below the surface. To confound things, it takes a very small change in temperature below the surface to have a fairly large change in OHC. The way the data for OHC has been collected changes over time. Most are biases to the surface temperature. More recently, the upper 2000 meters have been included. There is nothing simple about interpolating the older data to the newer data. The OHC therefore sucks, but that is just the way things are. So Tamino lambasting Tisdale for "Cherry Picking" what appears to be the best data is kinda funny to me.
So I started playing with some moving averages. I compared a 21 year backward looking moving average of the Hadcru data with an 11 year moving average. I could have used different time frames, I just happened to used these. While it is not very scientific, I expect the slope of these different moving average to be similar and that the R squared value of the longer moving average to be higher than the shorter moving average. The longer term is more smoothed, so there is less variation.

I also added the Dora Total Solar Irradiance (TSI) to this chart just for grins. I had to scale the TSI and the OHC data for the view I wanted. The yellow (21yma) and green (11yma) for the HADCRU are the only two I think are worth comparing since the time periods are much shorter for the other two. The scale of the Dora exaggerates the energy of the solar as directly measured, but is roughly what the impact some believe it would be with amplification of other natural factors. The correlation with solar is pretty minimal. It probably has some cyclic impact on surface temperature, but it would be pretty complicated to prove it has a significant impact (Maximum Overlap Discrete Wavelet Transform?). The 11 year moving average of the OHC shows pretty weird stuff at the start when the data is the poorest. I personally doubt there is a 10 year lag in OHC of that magnitude. I believe the data quality leaves a bit to be desired.

In this chart I dropped the Dora and chopped off the HADCRU to start with the OHC. The slope of the HADCRU moving averages changed as would be expected, but the R squared and relative slopes changed. To me this is an indication that the earlier data quality is not the same as the later data quality. There are larger adjustments made to the earlier data plus other factors. This doesn't indicate which is better or how much better (worse), just that there seems to be a difference.
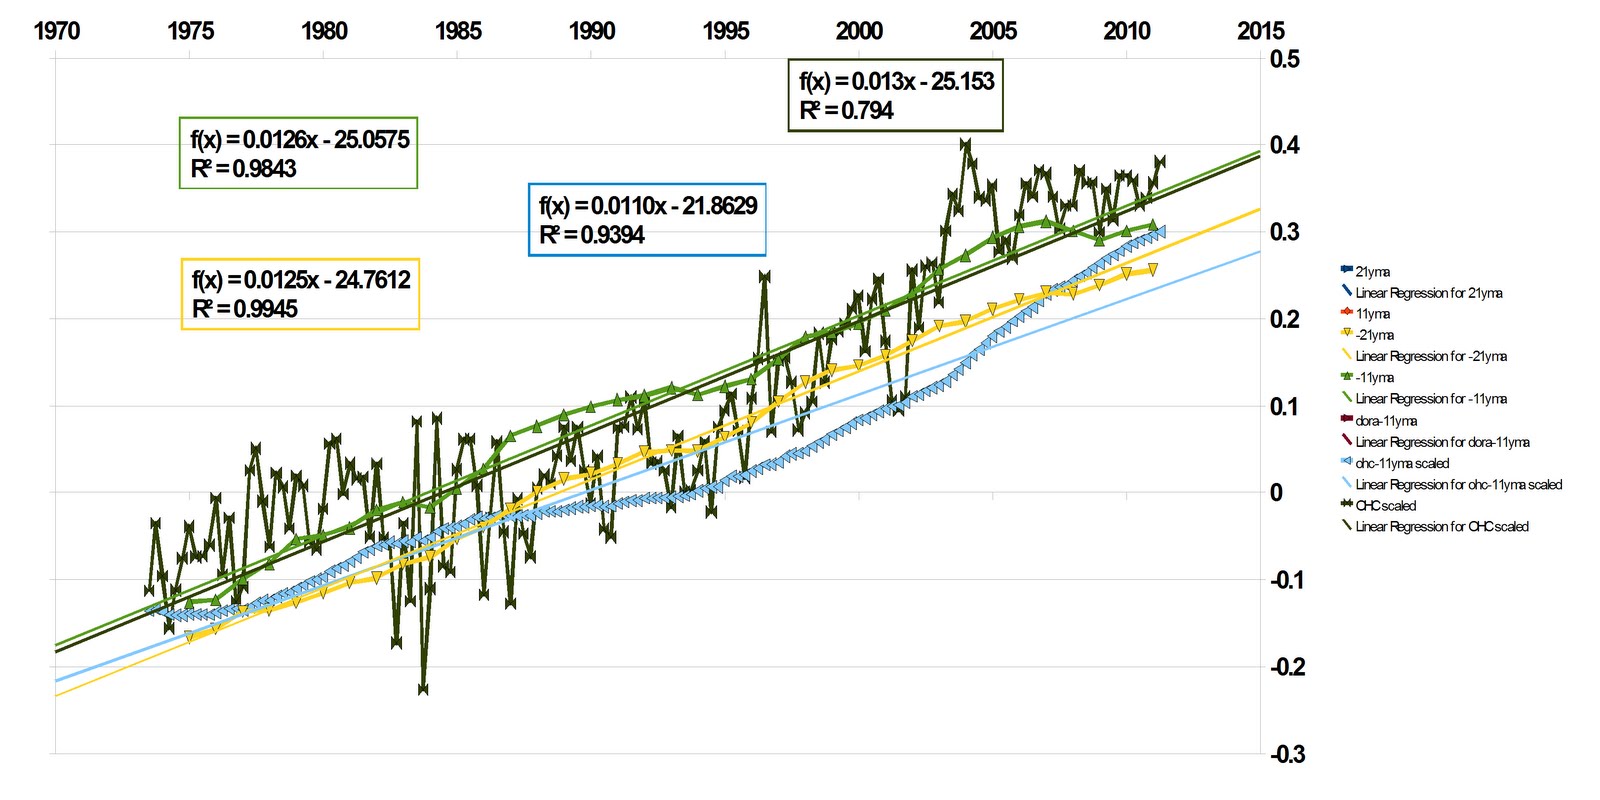
In this chart I chopped off the weird start of the OHC and the HADCRU to match. I also added the OHC quarterly data with trend. Even with the shorter time period the agreement improves between all four plots. To me this indicates an improvement in the data quality. The start time happens to be around the time that more work was started to analyze anthropogenic impact on climate.
Comparing the charts just states the obvious, the quality of measurements improve with time. So to me "cherry picking" better data is not only okay, but required if you want to learn more about things. I don't see why there is so much squawking about cherry picking if done properly.
I am curious about the 1910 to 1940 surface temperature data. Allowing for uncertainty in the data quality of the 1910 to 1940 versus the 1980 to 2010 period, there are probably clues in the comparison.
There are a good many clues that may be lost in the ridged treatment and selection of different data sets. Paleoclimate data series tend to be overly smoothed trying to dig out whatever signal there may be. "Regional" climate impacts in the past are smothered by the signal processing and weighting of series. In general, I feel that many scientists are overly confident in their results. This makes them overly sensitive to what should be constructive criticism and questions they feel they have adequately answered with older analysis. As the data improves the projections improve. More scientists should update their analysis online so we all can get a better view of the changing picture.
BTW: My methods may be crap, but the charts are looking better :)
Tuesday, May 17, 2011
The Wager and Ocean Heat Content
Since I was playing with data to see if the 2015 climate wager a fair bet, I thought I may as well include the Ocean Heat Content (OHC) data. I linked to the data on Lucia's site were she was wading in on the tiff between Tisdale and Tamino.
The OHC data is probably some of the most important for determining the change in climate. It is also some of the worst data available. Tisdale honed in on some of the more resent data, from 2003, when the ARGO floats started measuring the temperature, salinity at depths of 2 kilometers. I have never played with this data before, but assumed that ARGO must have made some improvements. The ARGO data is far from perfect, but better than what came before.

In the chart above you can see that the OHC data is pretty noisy. Around 2001, there appears to be a flattening of the trend and less noise. The noise decreases from 2001 to about 2004, then stabilizes somewhat. The change in the noise is so much I can't even guess if there is the start of a real trend or if before 2001 the data was just pure crap. It is probably a little of both, but I don't think you can say with confidence anything but OHC has increased. I plotted the quarterly data in blue with annual in red.
Since I am playing with the wager, I took the same time frame, 2001 to present that I did with the other data. I stuffed a few short regression lines on the chart above, then made a new chart starting in 2011.

This shows there may be a real flattening trend, but that warming might increase until 2015. There are not enough data points in the quarterly data to do much predicting. The data looks odd though. I would expect seasonal fluctuations in the OHC, but not that much. Looking at the quarterly data the northern hemisphere winter has most of the peaks. That is not unexpected, the southern hemisphere has more ocean area. The angle of the sun though still favors the northern hemisphere. So I chopped out the first and second quarter data then made a new plot.

With a short time frame, noisy data and not many data points, this probably means nothing, but it is a little odd that here the possible trend turns negative. A negative trend that better matches the ENSO/PDO is what I would expect. With the limited data, comparing the first half of the year to the last half could show anything. Still that looks to be a fairly significant change in the slopes. Does it mean anything? Dunno. From a wager stand point, it reenforces my opinion that the wager is a toss up, but that is my gaming point of view not a very scientific point of view.
It does get me thinking though. Most scientists are looking for lags based on fix time periods. I think it is more reasonable that lags are likely related to threshold values. Fixed time lags, perfect correlations and dominate specific natural drivers are not what I would expect in a somewhat chaotic system. Natural variation can be amplified, but I doubt that a tight phased locked loop type of control is in charge of the amplification. A little extra CO2 or land use change or dry/wet annual change or touch of an increase/decrease in solar could shift the threshold. Throw in a few oscillation shifts and before long you have a complex puzzle.
When I was picking on Nicola, he was looking for lags that matched the small changes in solar energy and estimated about 60% natural forcing. That may be true in the past, even using the slightly outdated reconstructions, but it does not have to apply to the future. Wagering wisely requires knowing probabilities, but winning against players that also know the odds, requires the use of tells, hunches, patterns and gut instinct. You will never win every hand, but knowing your opponent tilts the odds in your favor, until he shifts his pattern.
UPDATE: After more eyeballing and even resorting to ttests, the data before the middle of 2003, sucks. It is not all that great after 2003 either. The ocean heat content has been dead flat since 2004 for all practical purposes. Mention the rise in OHC though and you may get better odds.
Monday, May 16, 2011
Climate Wagering - Have the Aliens Landed?
Because of a simple bet, I found a few data bases easily on line to use my own simple methods determine how fair I felt the bet to be and how confident I felt about wagering (i.e. how much I may wager myself). Since the only thing at risk is a little of my money, I can use unproven methods, make large assumptions and cherry pick the data I wish for my analysis. Should I have found the data compelling, I would have tidied up my analysis and used more standard methods to verify what is had found to justify a larger wager. The greater my confidence, the more I would bet.
So how is this different than the real world? There is no difference. A climate scientist or group of climate scientists find that there is very high risk which means a high cost to reduce the risk. The people financing the bet want to be confident enough to justify the wager, so they want more standard analysis done before writing the check. Not understanding this is odd, one might think alien behavior.
The stacked regression analysis I may have created (the same thing can be done various ways)could be considered "novel". That is a big leap, but it is just for an example. A variety of statistical analysis methods used by climate scientists are "novel". It is reasonable to me that if the climate scientist wants backers for his bet he would be willing to allow more in depth analysis of his data and methods.
This is a major sore point in the climate change debate. People expected to chip in on the financing want confirmation. The methods used by some of the scientists is novel enough that other statisticians and scientists will not sign off on the "skill" of the analysis. The reviewing statisticians and scientists need the actual codes for the analysis and data used in the analysis to reproduce the results.
For some reason, the scientists won't or can't provide the actual data and the code as used in the analysis to the reviewers. Since the reviewers can't reproduce the results, they are not willing to chip in on the wager. That's life in the high stakes climate change betting game.
Most climate scientists are human (There are a few suspected aliens, one has indicated he may be Venusian), and as all humans are fallible, make mistakes. Human scientists know that and search for their own mistakes and will grudgingly admit their mistakes should someone else find them. Alien scientists believe they are infallible, which may be true on their home world. Scientists that are alien or heavily influenced by alien cultures, don't understand the human logic of intense analysis before going all in.
Alien logic dictates that if an analysis method is less than optimum (remember they are infallible,) that increasing the complexity of the analysis improves its accuracy, though it reduces its reproducibility. The alien influence on Wall Street where Maximum Overlap Discrete Wavelet Transforms are used to determine that the longer your money is in a hedge fund the more risk you assume, illustrates the beauty of complex analysis.
Humans know that reduction in complexity is required to convince financiers to pony up the cash, if the potential financiers are wealthy, and that increasing complexity is useful in convincing the less savvy masses (pension funds), to chip in on the wager. This is the, "if you can't dazzle them with your brilliance, baffle them with bullshit" truism.
Determining if a scientist is alien or human may be a new game, "Is he/she Alien?" Any game should have reasonable rules. Perhaps we can take a test scientist for trip through the analytical gauntlet to get an idea of the basic rules.
Nicola Scafetta, is thought by a few to be of alien origin. He has a published, peer reviewed paper that used data from the ACRIM and CRU with methods outline in his paper which he suggests are clearly explained in this book. On Nicola's website he lists his publications. One of his published papers is actually written in English so that is a good one for humans to review. Note that his papers in an alien language do not necessarily prove he is an alien.
The book he referenced costs money. Savvy financiers will not invest a dime until there is a reasonable expectation of a return on that investment. So we will keep the game simple with rule number one - Shell out cash only when you expect a return on the investment.
Since we humans are on the lazy side (that is not a dig, lazy is an efficient use of mental and physical energy), Rule two - look at the easiest stuff first. The CRU data is easily download and can be imported into any spread sheet. Once on a spread sheet, we can export it to any program we wish.
The CRU data Nicola linked to is our first clue. Humans know that humans make mistakes and the more steps a human takes the more mistakes they are likely to make. The CRU data has no notes. Those may be on a previous page, but the link was to a page that had no notes. The data on that page appears to be monthly temperatures with annual averages below in the next row. Mixing data by rows complicates the use of the data. Also the data appears to be space separated values, but the number of spaces are inconsistent for the apparent monthly data further complicating the use of the data. There are 13 columns in the apparent monthly data. One of those columns may be a monthly average or they number of months may be based on an alien calendar. A quick check indicates the 13th column is likely to be an average of the monthly temperature anomaly. The data that appeared in the alternate rows then may be actual temperature rather than anomaly. Since I don't care, I am trashing the alternating rows and just using what appears to be anomaly data. I would assume the anomaly data is global average anomaly, but since I am human and therefore lazy, I am not going to waste my time trying to find out for sure. It is my money Nicola wants, if he wants it bad enough he will make it easier for me to justify the investment. I expended the least amount of effort possible to organize the data he linked for my analysis.

If I didn't mess up, this may be the data that Nicola used. If I did mess up, I don't really care. I am not selling this stuff, Nicola is, I just want to see if it is worth the investment.
The ACRIM data is somewhere on the page Nicola linked. Right now I am pretty sure that Nicola is not a very good salesman. The more work I have to do, the less likely I will invest. If Nicola was really hungry to sell, he would simplify the effort for potential buyers. Since I just happen to have the ACRIM TSI data and a few other TSI records/reconstructions from Leif Svalgard's website, I will use them instead of fighting with ACRIM site which lists data products but won't let me down load them.
The solar TSI data has a mean of roughly 1366. I adjusted the DORA set so that it has the same mean value for the same range (I trimmed the Hadcru set a few years so I am using the same time periods for the DORA set.) Since the ARCIM set is short, I adjusted its mean, but let it float a little above the mean of the others. Both TSI sets were scaled with 0.25 multiplier to roughly match the amplitude of the temperature set.

Above is a chart with the data collected. Scaling can be changed as needed based on Nicola's paper to see what it looks like. I used the DORA TSI set because I want something recent and unbiased. If need be, I can add the Lean at al 2000 or Lean et al 1995, but since both have been revised, I would rather avoid their use.
In Nicola's abstract, he states that they find that at least 60% of the warming since 1970 is due to natural effects created by the orbital cycles of planets, mainly Jupiter and Saturn. The planet's gravitational forces tend to tug the Sun around, changing its impact on climate. This impact is seen in decadal and bi decadal cycles. In the introduction Nicola lists a variety of oscillations that appear to some what match the orbital cycles and even mentions the Chinese calendar which most of us have seen parts of while enjoying Chinese buffets. A pretty convincing argument that there is a lot of stuff going on, but I will pause momentarily to order Chinese.
Before spending much time trying to reproduce his work, I would like to see if it is worth the effort. Nicola's paper was accepted in April of 2010. The most recent TSI reconstruction he listed was Solanki 2007 with Lean 2005, 2000 and 1995 and Hoyt 1997. Without creative methods, there is not much correlation between the HADCRU temperature series and the TSI measurement (ACRIM) and reconstruction (DORA.)

The Solanki 2007 is not on this chart using Svalgard's data. The Wang reconstruction should be the same or similar to the Lean 2005. It would appear that since the TSI reconstructions Nicola used are a little out dated that his conclusions may be over estimated. This causes this potential investor to think:
1. The newer data will likely change the results.
2. Since the code for Nicola's paper is not available, I would have to reinvent the wheel to first replicate his code, then update the data used in his analysis to see if newer TSI reconstructions changed the results.
Conclusion: Nicola probably is not an alien because he exhibits the human trait of laziness by not providing working code and as used data sets. However, the complexity of his analysis does tend to lean toward alien behavior. This possible investment will be tabled until the proposal is revised. Time to eat Chinese.
Sunday, May 15, 2011
Fukushima Reactor Meltdown- More Thoughts
Japan Probe, an interesting website I found during the earthquake/tsunami/nuclear disaster, reported recently that the Fukushima event was a confirmed meltdown. That is not particularly surprising, Chernobyl and Three Mile Island (TMI) were also meltdowns. The Fukushima situation ranks in the middle of Chernobyl and TMI as far as meltdowns go.
In the Japan Probe post, I saw my first artist's depiction of the core for reactor 1 at Fukushima Daiichi. Wikipedia has a similar depiction for TMI and a real picture of Chernobyl.
Chernobyl, most people will tell you, was an extremely poor design. There was not much thought put into containment.

As you can see from the Wikipedia picture above, the design lived up to expectations and did a poor job of containment. Unfortunately, for the Russians, the Chernobyl accident improved the World's understanding of the risks of nuclear power. It did too good of a job at that really. Only people that can compare the design realities get the real picture.
One thing that Chernobyl should have taught people is that the China Syndrome movie was just that, a movie meant to be exciting and suspenseful. The China Syndrome is a ludicrous description of more than a worse case. A nuclear meltdown will not burn its way to China. It can cause a very nasty situation.
TMI was a frightening situation with little nasty radiation fallout. The totally different design of the TMI reactor shows that responsible design makes a huge difference in end results.

The artist depiction above illustrates that a fifty percent meltdown was contained in the pressure vessel as it was designed to do.

The photo of the artists depiction of reactor 1 at Fukushima is not as detailed as the TMI one, it will take some time to determine more exactly what happened, but it is the best we have for now. The report Japan probe links to indicates that the plant operators think the melted fuel may have burn a or several small holes in the bottom of the reactor pressure vessel which allowed radioactive water to leak into the reactor dry well, then the containment building and then underground to the turbine building. This seems a little unlikely to me, but possible I guess.
My theory was that attempts to cool the reactor with limited water caused leakage at the piping connections to the reactor near the penetration of the high pressure steam pipe penetration of the containment building. That would give the radioactive water an easier path to the turbine building.
During the attempt to cool the reactor, the operators pumped huge amounts of water which could over flow the dry well, which could fill the containment building, but that does not appear to be the case. How the water leaked out of the dry well is a mystery to me, but the operators are there and I am not. I still have my doubts, but that does not mean anything.

This drawing of the Fukushima reactor containment design looks to me like leakage from the containment structures to the turbine room would be a little difficult. Leaking into the dry well though would not be. The same thermal expansion and contraction probable with the sporadic and inadequate water available could somewhat easily cause leakage at the control rod penetration of the reactor pressure vessel. The two penetrations that the control rods move through complicate the leakage path, but it is possible.
The interesting part of the design to me is that even with the lower control rod mounting, it would be extremely difficult for molten fuel to burn through the pressure vessel containment. The main pressure vessel is made of layers of steel which greatly reduces the chance of thermal stress fracturing and burn through. I am not sure, but the second penetration is probably layered steel as well.
In any case, the amount of water they were pumping in had to go somewhere. Whether I am right or not does not matter, what does matter is the that the old design basically did what it was designed to do, contain the fuel.
The situation with the spent fuel pools, especially at reactor 4, interests me. All of the pools should have been safe for at least 6 days without cooling or make-up water. SFP 4 had the highest decay heat load, so it is logical that it would have become a problem first. The SFP 4 situation may have exposed a design or operational flaw. Generally, make-up water flow, nearly twice the evaporation rate, would be available. The volume and depth of the pool should allow more than enough time to re-establish make-up water flow. This may have been over looked as a priority, operationally or due to the overall situation, which exposes a design issue. In turn, that may have exposed a near empty design flaw.
The pools are designed for safety when full without cooling and when empty. When full, make-up water is all that is required and there is nearly a week to find it. With the pool completely empty, the storage racks have enough ventilation for passive cooling. The problem is that when nearly empty, the ventilation is blocked by water at the bottom of the racks, which can cause over heating of the rod assemblies. This issue is sure to be investigated as a priority concern.
More Analyzing the Wager to Death
The wager based on the 2015 average GISS surface temperature versus the 2008 surface temperature is interesting. The overly simple regression analysis, (or eyeballing) leads me to believe that the wager is pretty fair and is virtually a coin toss. The originator of the wager of course feels that it is a sucker bet, or he would not have made it.
In my opinion, the timing and intensity of the ENSO quasi-cycle makes or breaks the bet. The surface temperature response to the ENSO/PDO quasi-cycles does tend to favor the originator of the wager. The atmosphere responds differently to the ENSO/PDO than many would expect.
Sensible heating (warming) has a quicker temperature response than sensible cooling as it approaches the latent cooling threshold. So while the GISS temperature shows warming quickly, cooling takes a longer time to happen. There is some correlation between the GISS temperature and the ENSO/PDO, but that is super imposed on a general warming trend. Part of that trend is due to land use/CO2 and part is the natural way the atmosphere responds to sensible cooling. In order to cool, the ENSO/PDO cooling impact has to be enough to cause enough latent atmospheric cooling. Since the Hurricane ACE is low, that part of the latent cooling is not available (which is fine by me).
The difference in the rates of warming and cooling is pretty clearly shown in the temperature record if you compare the slopes of the warming trends to the cooling trends. That means that a lag in cooling relative to ENSO/PDO is somewhat likely, more sever winter storms and chaotic spring storms take longer to get rid of the moisture than a kick butt hurricane season. This makes predicting future climate more complicated and the wager more fun.

The above chart is the GISS global surface temperature in the burgundy color that may look black with the period from 1950 to 1982 in thin line and the rest in thick line. The regression for each period is shown in the same color with the varying thickness. In the orangeish color is the ENSO Data from NASA and in the light blue is the PDO index data from the University of Washington. I have inserted an orange dashed mean line for the ENSO which is pretty close to the PDO index. The chart is pretty busy and I could have picked better colors, but the information is there.
Prior to 1982, there was a better correlation between temperature and the ocean oscillations. After 1982, the temperature trends keeps on heading up with some correlation with ENSO/PDO super imposed on the warming temperature trend. The correlation is not all that great because there are more pieces to the puzzle, but ENSO and or PDO do appear to be players in the puzzle of reasonable significance. It is a wager analysis, so I can take a few liberties.
The more the ENSO/PDO trends falls below the ENSO mean, the more the impact the ENSO and/or PDO appear to have on the temperature trend. So there is a cooling lag, not dependent on time, but dependent on a magic temperature threshold that can change with the overall impact of various forcings both natural and man made. Since the ENSO/PDO values are at the lowest point since 1982 and on a par with the values prior to 1982, there is a reasonable likelihood that the GISS temperature trend can flatten and possibly start cooling if the ENSO/PDO trend continues below the mean of the overall trends.
I call the temperature threshold magic, because I have no idea what its real value is in the current state of the oscillations. I am pretty confident that if the temperature trend starts to cool, that the cooling slope will be less than or equal to the slope of the last cooling trend.

In this chart from before, I weighted the analysis to the near term, because of the wager. The blue line is the regression of GISS global monthly from 2001 and the red line is the regression for the wager start date in 2008. Warming wagers will base their confidence on these trends (pseudo trends if you prefer). The Orange line is the regression starting in 2009, March. The orange pseudo trend was cherry picked to find the most resent regression with roughly the best R squared value. That should be the maximum cooling pseudo trend possible with current conditions. The two dashed trends are the more recent pseudo trends which I use to estimate the more realistic near term path of a cooling trend should it actually develop. The green dashed line is the win line for the guys betting on 2015 average being below 2008 average.
All this boils down to the ENSO/PDO staying at or below the magic temperature threshold. As a reminder, I am not a climate scientist, statistician or psychic, I just enjoy a friendly wager on occasion. Anyway, the climate science professionals may get a kick out of this analysis because when wagering is involved, cherry picking is allowed.
Saturday, May 14, 2011
Analyzing the Wager to Death
The great thing about a wager, is even if you are not involved, you can waste time, cheery pick, try crazy stuff to rationalize the outcome, just do about anything and it is perfectly acceptable irrational behavior. So I am analyzing the wager to death!
The stack cluster thing I am using is not predictive, it is just a ballpark look a things. The timing of the wager fairly short term though. It is will the temperature recorded by GISS in 2015 be above or below the average of 2008. The data is noisy, this La Nina will fade, a new El Nino will start and the period of the bet may be in the middle of a new La Nina. It pretty much is a coin toss.
Just to try to get a little better picture, I changed the length of the individual stacked regressions to 24 months. Since I am more concerned with the future, I made a chart of the most recent regressions with overall linear regressions from 2001 and 2008 to the end of the data in March of 2011. The most recent 2 year regressions indicate a down turn. That is of course subject to change. So I added one more regression starting at March 2009 to March 2011.

The main clustering was positive, so temperatures should rise, but with 2015 just around the corner, I biased the stack for the closer term. At least that is what I think. Because the RSS and UAH data for April are already out, I know that there is an up turn as the La Nina fades. The orange 2009 to 2011 line should be a lower limit for the next few years. Hansen's GISS data tends to be the warmest of the surface averages and GISS on occasion makes new adjustments to their data. By 2015, I would not be surprised if GISS adjusts a little to get more in line with the other guys. The bet was against the 2008 average which is already published, so I am thinking 0.5 with remain the target, even if it is adjusted down a touch.
After all this playing around, it still looks like a toss up with the winner being the one guessing the start of the next La Nina. I may waste some more time and download the ENSO to see how that may come into play.
Friday, May 13, 2011
Ethos and the Bullshit Detector
e·thos (ths)
n.
The disposition, character, or fundamental values peculiar to a specific person, people, culture, or movement: "They cultivated a subversive alternative ethos" (Anthony Burgess).
A writer should have Ethos. If your are studying with a professor, you assume his Ethos. That means you would think as a professor, he would behave, think or do what a professor would do. All God's chillin's got Ethos. Since perceived ethos is going to determine what you believe about something or someone, it would be good to have good ethos. It also means you can be misled by people, because you think too highly of them. It also means you will ignore what they say or do, if you have the perception of poor ethos, like "that dude is from a bad crowd full of idiots". Since few of you guys know me and I don't have letters behind my name, you have even less clue if you should listen to me other than you would any other blogger. So I am going to build my bullshit detector so you can figure out my ethos and the ethos of others.
Now if I just post up stuff, that doesn't help. There is a huge gap in public perception based on ideology, race, religion and culture. So for all the left wing thinkers I am going to use a lecture from Berkley, liberal bastion of education for many.
From a lecture series, "Physics for Future Presidents", By Dr. Richard A. Muller, professor of physics, University of California, Berkley.
The video is 48 minute long and explains the basics of radioactivity.
This video is an hour and thirteen minutes long.
Both of these were posted first by a commenter on watts up with that. They will work setting up my radioactivity and nuclear energy bullshit detector.
The bullshit detector will have (when I am done) lots of stuff to help you understand basic physics, so you can detect bullshit. I am starting with radioactivity because all sorts of radioactive processes formed the universe as we understand it. There is tons of information you can gain about our past and future from understanding radioactivity.
Alpha particles, little bits of an atom's nucleus, beta particles, electrons loss that change an atom's charge and gamma rays, electromagnetic radiation emitted during radioactive decay, are all around us. We can't live without them, so let's try to understand them.
An Alpha particle is the largest atomic particle, it is two protons and two neutrons, just like the nucleus of the Helium atoms. Clothes, paper, just about anything, even air, will stop an alpha particle.
A Beta particle is normally an electron though it can be a positron also known as an anti-electron. A beta particle is very small and more energetic that an alpha particle, but can be stopped with thicker solid objects. (Gases also but that is another subject.)
Gamma rays are electromagnetic energy released by radioactivity. They are the most energetic of the three common forms of radiation and very difficult to stop. They are the reason for lead shielding commonly used working with radioactive materials.
There is one more common particle, the neutron, which is basically a proton without a charge. Alpha particles, beta particles and neutrons are all particles because they have mass. An alpha particle has the mass of two protons and two neutrons, a beta particle has the mass of one electron. Protons, neutrons and electrons all have very small masses, 1.67262 x 10^-27, 1.67493 x 10^-27 and 0.000910939 x 10^-27 kilograms respectively. I only put those numbers in to show that a neutron's mass is about the same as a proton plus an electron. A free proton is called a hydrogen ion and is considered stable, but a free neutron is not stable, within about 15 minutes it will breakdown into a free proton, an electron and something called a neutrino.
To give an idea how small their mass is a billion is 10^9. A billion times a billion times a billion is 10^27, so a neutron is 1.67493 divided by a billion times a billion times a billion. The proper name for something a billion times a billion times a billion is 1,000,000 Zeta . One divided by 1,000,000 Zeta is 0.000001 Zepto. There are real big and real small numbers used in climate science and nuclear physics. The reason I used Zeta (10^21) and Zepto (10^-21) is because of the electron volt. One kilowatt-second (note: not kiloWatt-hour) is equal to 6.2415 Zeta (10^21) electron volts is equal to 1000 Joules. Every scientific bullshit detector has to have a scientific notation and units converter. This link is for one of many Free Energy and Work Conversion Tables available online.
Why is this important? There is a government report that says energy demand will increase from 495 quadrillion in 2007 to 543 quadrillion in 2015 (I am not kidding). What the hell is a quadrillion?
quadrillion [kwɒˈdrɪljən]
n
1. (Mathematics) (in Britain) the number represented as one followed by 24 zeros (10^24) US and Canadian word septillion
2. (Mathematics) (in the US and Canada) the number represented as one followed by 15 zeros (10^15) determiner (preceded by a or a numeral)
a. amounting to this number a quadrillion atoms
b. (as pronoun) a quadrillion
[from French quadrillon, from quadri- + -illion, on the model of million]
quadrillionth adj
Collins English Dictionary – Complete and Unabridged © HarperCollins Publishers 1991, 1994, 1998, 2000, 2003
So a British quadrillion (10^24) is a Billion (10^9)times bigger than an American quadrillion (10^15). That makes an umptillion (10^?)of sense to me? So use of scientific notation (10 to the whatever) makes sense. Use of goofy term for some power of ten does not, unless it is a standard scientific goofy term.
In the first video the size of a proton is compared to the diameter of an electron's orbit or shell is like a mosquito in the middle of a football stadium. So if an electron volt is the size of a mosquito,how long would a line be if you lined a watt-second worth of mosquitoes up? 3 millimeters (10^-3) times 1 million (10^6)is 1000 (10^3) kilometers, a billion mosquitoes would be a kilometer long placed end to end. If you subtract a billion (10^9) from a Zeta (10^21) you get 10^12. So a line of mosquitoes equal to the number of electron volts in a Watt-second would be on the order of 10^12 kilometers long or 1 trillion kilometers long. I said order of magnitude because, how big is 6.2415 compared to 1,000,000,000,000?
Back to radioactivity, the explosion of one atom in a nuclear reaction is roughly(about) equal to one million (10^6) explosions in a chemical reaction. Make a note, roughly and about tingle the bullshit detector, but are valid as long as the units and order of magnitude are right. So one pound of uranium 235 is about equal to a million pounds of coal. 2000 (2x10^3) pounds is a US ton, so a million (10^6) pounds of coal is 500 US tons of coal (no about is used because it is a straight forward conversion). In case you were wondering, 500 tons is a little less than 5 rail cars full of coal(a little less because hopper cars range from 80 tons to 130 tons, 110 tons is the approximate average).
Just for fun, one coal train can have about 130 hopper cars with up to 130 tons of coal per hopper car for a total of 16,900 tons of coal. About 34 pounds of Uranium 235 replaces one coal train assuming 500 tons of coal per pound of uranium.
I used about, up to and assuming in that sentence. Would the bullshit detector tingle or go into full alarm? Just tingle, it is pretty easy to verify basic data and calculations. About, up to, assuming, likely, unlikely and "highly" versions of both and uncertainty, are all terms you should expect to see when dealing with a complex subject. Trust but verify!
Depending how well the nuclear reactor is designed and the efficiency of both the reactor and the coal plant used in the comparison, you can get much different numbers. this is the apples and oranges conundrum. Without even trying to, an honest scientist or writer can bias their results. People can also make mistakes. People can also lie. So the bullshit detectors should have a needle with green, yellow and red indications on its dial.
Equating a pound of U235 to 500 tons of coal is a convenient way of relating to the general public. Journalists do this all the time and scientists, good ones anyway, try to most of the time. Peer reviewed scientific papers have abstracts and conclusions that a person with a bullshit detector can use to double check facts. That is not true if the paper has scientific reviews and corrigenda published after the paper was published. A corrigenda is a published correction to a paper published in a peer reviewed journal. Scientific reviews that mention possible errors are rarely published with the paper either. Referencing outdated or flawed papers is pretty common. Out of context referencing is common as well.
There are people that live to check facts. Snopes.com does a very good job and should be in everyone' bullshit detector. Climate change and nuclear safety are not Snopes strong suits. There are a lot of wanna be climate blogs and nuclear blogs that try to be like snopes. Some do pretty good and some suck. There are very few that do not have some bias that effects their choice of topic or interpretation of data. One of the good ones for climate science is science of doom. For nuclear energy, the nuclear tourist is a good source. Both of these stick to the facts and don't draw hard conclusions without good reasoning. There are tons of other sites that have good information, but enough flaws that you have to be careful.
I am adjusting the nuclear energy range on the bullshit detector, so let's look at the nuclear tourist. It provides a lot of links to relevant documents available online. That is a good thing, but it is difficult to navigate and requires a lot of effort on the part of the curious to do his own research. Links that are hard to find are some of the best like Why Nuclear? That is an accurate list of the pros and cons of different energy sources with good links to get more information. It does not get into any detail about the pros and cons though. That is one of the reasons I started this site and this bullshit detector. The Nuclear tourist is a good but limited resource. Wikipedia is a fairly good source, but doesn't give definite conclusions. So good sources that do not require a bullshit detector may not be of much help. You have to go to more controversial sites with your bullshit detector some times or just trust the policy makers.
Nuclear Power Now! sounds like it may be a little opinionated. A quick scan shows no outrageous claims and does provide quality links (I did not check them all) to support statements. Nuke Free dot org. sound pretty opinionated. Oops, there goes the bullshit detector!
"Regarding water impacts of nuclear power plants, almost every single operating atomic reactor has leaked radioactive tritium into groundwater, sometimes in massive amounts. When not leaking into groundwater, nuclear power plants have permission from the Nuclear Regulatory Commission to "routinely release" tritium and other toxic and radioactive pollutants into the nearby river, lake, or ocean." Damn that is sensational and we should all join their emotional plea to protect us from what?
"What is Tritium?
Tritium (H-3) is a weakly radioactive isotope of the element hydrogen that occurs both naturally and during the operation of nuclear power plants. Tritium has a half-life of 12.3 years and emits a weak beta particle. The most common form of tritium is in water, since tritium and normal hydrogen react with oxygen in the same way to form water. Tritium replaces one of the stable hydrogens in the water molecule, H2O, and creates tritiated water, which is colorless and odorless.
Tritium can be found in self-luminescent devices, such as exit signs in buildings, aircraft dials, gauges, luminous paints, and wristwatches. It is also used in life science research and in studies investigating the safety of potential new drugs.
For more information on tritium exit icon"
You can read the health risks of tritiated water here http://www.nrc.gov/reading-rm/doc-collections/fact-sheets/tritium-radiation-fs.html
Tritium is a beta particle emitter. Bananas (potassium 40) are a beta particle emitter. You ingest water. You ingest bananas. A banana dose of radiation is 520 picocurries (10^-12 Curries) per banana. How much more tritium than the normal 1600 to 3000 picocurries will be ingested by people drink ground water in the area? Do people drink ground water in the area? Why the hell should I be worried about the tritium that may go into ground water that already has tritium in it that no body drinks? Without going any further the impassioned authors are long on hype and short on substance.
Should the plant release any tritium? Should there be rodent hair in my hotdogs? Should I petition to to have zero exposure to tritium, rodent hair and di-hydrogen mono oxide while I am at it? Do y'all get the picture? Impassioned, liberal and literate do not mean right nor does impassioned, conservative and illiterate. Oh, I forgot, right is wrong and left is right. No friggin' wonder I am not politically aligned. That's how the bullshit detector works. I would need to do a lot of research and calculations to determine the public health impact mentioned, which the author was too lazy to do. So blow these buttwipes off.
Here is a list of anti-nuclear power groups and here a list of pronuclear power groups, er there aren't linked in wikipedia. President Obama is supporting new nuclear power plants, so he must be a right wing nut job. Okay enough piling on. The guys think it is the right thing to do, so even though they are wrong, they are doing the right thing:) I like my new bullshit detector!
Buttwipes have no party affiliation, so expect the bullshit detector to go off often. As I post things on this blog, I am going to reference back to this bullshit detector. I may have to do some research for the new post, so I will try to outline the things I had to go through to understand the subject of my post. Then the bullshit detector is a living resource. Do what the videos when you get a chance. There are pros and cons to each energy source, the more you know the better.
Radiation treatment for cancer is when plenty of people get up close and personal with radioactivity. Cancer and radioactivity both scare the hell out of people. In the second video, Dr. Muller touched on chemotherapy and radiation treatment. Cancer cells are mutant normal cells that have gone nuts procreating. Their new mutated genetic code tells them to go forth and multiply like crazy. The new code does not tell them to use protection. So these mutant cells are killed more easily by poisons, chemical or radiative, than normal cells that practice safe sex. Dosing the whole body kills the cancer cells. The trick is not to kill the patient. Since radiation can be focused on the malignant cells instead of all the cells in the body, it can do less damage while getting the job done.
Radioactive material that emits beta particles can be implanted in the malignant tumors to slowly kill the tumor from the inside out(invasive). The whole body can be shot up with radioactive material to kill wide spread cancer (systemic treatment, normally radioactive iodine (I-131), a beta emitter for thyroid cancer). Gamma rays (and/or x-rays) can be shot at the tumor(s) killing the tumor(s) uniformly. Shooting the gamma rays from two or more angles at the same time or at different times, increases the dose to the tumor while decreasing the dose to healthy tissue.
For the Climate Change issue, here is the first part of the growing climate knob.
Subscribe to:
Posts (Atom)