Thirty-three degrees C is the iconic value of the impact of greenhouse gases on Earth's climate. It is an estimate, probably not a bad estimate, but not carved in stone. CO2 does have a radiative impact on climate. Without it the world would be cooler, with more the world will be warmer, if all things stayed the same.
In the coming Ice age series, I am exploring the impact of water on climate, which is a much stronger and much more complicated Greenhouse gas. Most believe the addition CO2 in the atmosphere is over whelming the climate, but that same "most" don't feel that CO2 will cause a thermal runaway. The question to me has always been how much will CO2 do?
To estimate the impact of CO2, scientists calculate that with approximately 240 Watts/meter^2 at the top of the atmosphere (TOA) that the Earth's temperature would be 255 degrees Kelvin (K). So with the current temperature being 288K, greenhouse gases cause 33 degree K or C of warming. Based on this 33 degrees, the impact of CO2 can be calculated and about 1.2 degrees would be the impact of double CO2.
BUT, "If an ideal thermally conductive blackbody was the same distance from the Sun as the Earth is, it would have a temperature of about 5.3 °C. However, since the Earth reflects about 30%[6] (or 28%[7]) of the incoming sunlight, the planet's effective temperature (the temperature of a blackbody that would emit the same amount of radiation) is about −18 or −19 °C,[8][9] about 33°C below the actual surface temperature of about 14 °C or 15 °C.[10] The mechanism that produces this difference between the actual surface temperature and the effective temperature is due to the atmosphere and is known as the greenhouse effect.", From Wikipedia.
That reflection of about 30% is due to water vapor in the form of clouds in a large part. Liquid water which makes up most of our planet reflects only about 8 percent. Ice and snow reflect some and land some as well. Not including the reflective part of water vapor, can de-emphasize its relative impact versus CO2.
If Earth were a true blackbody, the temperature without a greenhouse gas atmosphere would be 5.3 C or 279.3 K or 9 degrees, not 33. If I estimate that water vapor accounts for 50 percent of the reflectivity, then the Earth without a greenhouse would be about 14 degrees cooler. Using the estimated 1.2 for a doubling of CO2 with this temperature, 0.51 degrees would be the estimated impact of doubled CO2.
There is nothing new here. With all things behaving properly, CO2 doubling will cause 1.2 C of warming. The difference between 1.2 and 0.51 just illustrates the uncertainty in the impact of clouds to an increase in CO2. The uncertainty with respect to clouds is nothing new either.
As if by magic, the IPCC estimated warming average is 3 degrees and the estimate based on observations is about 1.2 to 1.6 degrees. As I have mentioned before, that 3 degrees is not A estimate, but the average of two estimates. The first estimate was 2 degrees. So I think we should give a cigar to Manabe, the scientist that seems to have the better estimate.
If we take a look at the second estimate by Arrhenius, 1.6 (2.3 with water vapor) we have another estimate that is pretty close. The only fly in the ointment is Dr. James Hansen with his high estimate of 4 degrees. Well, he is nearing retirement.
Continuing: A while back I read an old post on Climate Audit, where Dr. James Annan tried to explain the estimate for climate sensitivity to a doubling of CO2.
"I noticed on your blog that you had asked for any clear reference providing a direct calculation that climate sensitivity is 3C (for a doubling of CO2). The simple answer is that there is no direct calculation to accurately prove this, which is why it remains one of the most important open questions in climate science.
We can get part of the way with simple direct calculations, though. Starting with the Stefan-Boltzmann equation,
S (1-a)/4 = s T_e^4
where S is the solar constant (1370 Wm^-2), a the planetary albedo (0.3), s (sigma) the S-B constant (5.67×10^-8) and T_e the effective emitting temperature, we can calculate T_e = 255K (from which we also get the canonical estimate of the greenhouse effect as 33C at the surface).
The change in outgoing radiation as a function of temperature is the derivative of the RHS with respect to temperature, giving 4s.T_e^3 = 3.76 . This is the extra Wm^-2 emitted per degree of warming, so if you are prepared to accept that we understand purely radiative transfer pretty well and thus the conventional value of 3.7Wm^-2 per doubling of CO2, that conveniently means a doubling of CO2 will result in a 1C warming at equilibrium, *if everything else in the atmosphere stays exactly the same*."
Before I estimated that clouds contribute about half the albedo so using Annan's equation we have 1370(1-.15)/w or 291.1 = s.T_e. So T_e = (291.1/(5.67x10^-8))^.25 = 268.9 K which is 13.9K greater than the 255K no greenhouse estimated temperature of the Earth. Instead of 33 C we could be 19.1 degrees warmer with a greenhouse atmosphere than without. Using the same derivative, the change in OUTGOING radiation required to increase the temperature 1 degree would be 5.59 Watts/meter^2 if I didn't screw up. Without going back through the derivation of the radiative impact of a doubling of CO2, I will assume 3.7 W/m^2 is correct. Then the temperature change for a doubling of CO2 would be 3.7/5.59 = 0.66 degrees C or K.
This does not mean that 5.59 W/m^2 is the radiative change in forcing required to increase the temperature one degree, just that water vapor may effect the initial estimate of 33 degrees. If the Earth was at an average temperature of 268.9 we would be in a snowball Earth, there would probably be less water vapor and more surface ice or snow so the impact of solid water with traces of water vapor could be an albedo of greater than 0.3. If the albedo of the Earth was .4, then T_e would be 205.5 and 3.4W/m^2 would equate to 1 degree change in surface temperature.
Note: This post is more of just a reminder for me. The accuracy of the ground based net infrared radiative measurements are not sufficient to confidently measure the temperature change for a small, less than one percent change in radiation. That may be changing.
Showing posts with label climate sensitivity. Show all posts
Showing posts with label climate sensitivity. Show all posts
Sunday, September 18, 2011

Thursday, August 18, 2011
Pondering Climate and the Greenhouse Effect
While most of the world has moved on to other more pressing issue, the climate change debate still rages among the devoted. Joseph Postma is a smart guy with degrees and everything that believes that CO2 has no significant impact on climate at all. Postma has a published paper, The Model Atmospheric Greenhouse Effect,where he attempts to set the scientific world straight. I can't really comment on the paper because the error in calculating the average solar power at the Earth's surface is so obvious, I won't waste my time. A year or so ago when I first heard of this my bullshit detector went off and I did the rough calculations myself and they happen to agree with NASA and the rest of the mathematically literate world, not Mr. Postma.
Most view Postma arguments comical or worse, but he some sway in the radical skeptic community. One defense he uses for his calculations is that there would be no liquid water on the planet if NASA's numbers are right. He is wrong, but the liquid water thing is something I have never written about.
Water is a remarkable substance. While all life needs to consume water to survive, water is much more important to our survival. On our world which has a surface covered with 70% water, things are a lot different than if there was less or if it were not located where it is. For example if the water was only at the poles and all the land mass was at the equatorial region, there would be no life as we know it. If there was 50% water and 50% land the same thing. Climate is somewhat stable because of the amount, location and properties of water. Our climate is extremely sensitive to water in all its phases.
First, think about the reflectivity of the Earth or its albedo. Snow is highly reflective, the tops of clouds highly reflective and liquid water high absorptive of solar radiation. Snow and ice reflect between 90 and 95 percent of the sun's rays. Water absorbs about 93% of the sun's rays. Same molecule, radically different properties. Water also has one of the highest thermal capacities of any element as a liquid, solid or vapor. It is remarkable.
The average albedo of the Earth right now is about .7 meaning we absorb about 70% of the solar radiation. The vast majority of that albedo is due to water which covers most of the Earth's surface and a good portion of the atmosphere. While the climate change debate is mainly about CO2 which may cause a percent or so change in the outgoing radiation that cools the Earth, water can make a 10% change in the outgoing and the absorbed incoming with just a little push.
With climate, water's importance is best viewed by the conditions during the glacial periods. Some trigger, an asteroid impact, slight change in orbit, passing through a comet's tail can reduce the absorbed solar radiation enough that more ice and longer lasting snow cover persists for a while. This decreases the Earth's albedo which decreases the heat absorbed, decreasing the heat stored in the oceans. The Earth moves toward what has been called a snowball Earth. Unlike too much global warming, too much global cooling has happened pretty regularly. Luckily, Snowball Earth is not really a complete snowball. Glaciers move further towards the equator and move closer to the surface, but never completely cover the entire planet. If they did, Earth would not recover without another catastrophic event. All indications I have seen indicate that the Earth recovers naturally until the albedo increases to a magic number that cues a new interglacial period like the one we enjoy now.
It is not really magic, but the combination of the right albedo, the right solar cycle series and the right amount of volcanic activity cue the change. There is not a lot of solar change, nor a lot of volcanic change, but a little of each change albedo which feeds back on itself to cause the big change. Just like the right decrease in albedo triggered and amplified the cooling, the right increase in albedo triggers the warming. The Earth has two temperature set points controlled primarily by albedo which is controlled by water.
Mr. Postma seems to think that the calculated average solar energy input is not enough to sustain liquid water. In my opinion this is the most glaring error of his paper. Even in the glacial periods which have much lower solar energy absorbed there is still liquid water near the equator. Since there is much more water along the equator than there is land, even a snowball Earth can sustain life.
Water is also the largest unknown in the global warming debate. A warmer world means the atmosphere can hold more water vapor which can either add to the warming or tend to reduce the warming. The room for warming to increase albedo is not as large as the room to reduce albedo. There will always be ice and snow at the poles in winter which will persists into the summer. The normal weather patterns with more water vapor in the air means the chance of larger snow storms and rain storms increase, both reduce albedo. The warming can cause longer and more severe droughts, but droughts are over land and most of the droughts will be in the temperate latitudes. Droughts in the temperate zones have less impact on albedo, tend to increase atmospheric dust which can promote cooling and increase radiative cooling locally because of less water vapor.
Increased water vapor also tends to block a portion of the CO2 radiative impact at the surface. The reason most impact of increased CO2 should be at the poles and upper troposphere is because there is less competition with water vapor.
So while there is no guarantee that warming will not be enough to worried about, thanks to water the likelihood of catastrophic warming is reduced.
Note: The average albedo is more like 30% meaning the absorbed is 70%. So the references to albedo are reversed, but the idea remains the same.
Most view Postma arguments comical or worse, but he some sway in the radical skeptic community. One defense he uses for his calculations is that there would be no liquid water on the planet if NASA's numbers are right. He is wrong, but the liquid water thing is something I have never written about.
Water is a remarkable substance. While all life needs to consume water to survive, water is much more important to our survival. On our world which has a surface covered with 70% water, things are a lot different than if there was less or if it were not located where it is. For example if the water was only at the poles and all the land mass was at the equatorial region, there would be no life as we know it. If there was 50% water and 50% land the same thing. Climate is somewhat stable because of the amount, location and properties of water. Our climate is extremely sensitive to water in all its phases.
First, think about the reflectivity of the Earth or its albedo. Snow is highly reflective, the tops of clouds highly reflective and liquid water high absorptive of solar radiation. Snow and ice reflect between 90 and 95 percent of the sun's rays. Water absorbs about 93% of the sun's rays. Same molecule, radically different properties. Water also has one of the highest thermal capacities of any element as a liquid, solid or vapor. It is remarkable.
The average albedo of the Earth right now is about .7 meaning we absorb about 70% of the solar radiation. The vast majority of that albedo is due to water which covers most of the Earth's surface and a good portion of the atmosphere. While the climate change debate is mainly about CO2 which may cause a percent or so change in the outgoing radiation that cools the Earth, water can make a 10% change in the outgoing and the absorbed incoming with just a little push.
With climate, water's importance is best viewed by the conditions during the glacial periods. Some trigger, an asteroid impact, slight change in orbit, passing through a comet's tail can reduce the absorbed solar radiation enough that more ice and longer lasting snow cover persists for a while. This decreases the Earth's albedo which decreases the heat absorbed, decreasing the heat stored in the oceans. The Earth moves toward what has been called a snowball Earth. Unlike too much global warming, too much global cooling has happened pretty regularly. Luckily, Snowball Earth is not really a complete snowball. Glaciers move further towards the equator and move closer to the surface, but never completely cover the entire planet. If they did, Earth would not recover without another catastrophic event. All indications I have seen indicate that the Earth recovers naturally until the albedo increases to a magic number that cues a new interglacial period like the one we enjoy now.
It is not really magic, but the combination of the right albedo, the right solar cycle series and the right amount of volcanic activity cue the change. There is not a lot of solar change, nor a lot of volcanic change, but a little of each change albedo which feeds back on itself to cause the big change. Just like the right decrease in albedo triggered and amplified the cooling, the right increase in albedo triggers the warming. The Earth has two temperature set points controlled primarily by albedo which is controlled by water.
Mr. Postma seems to think that the calculated average solar energy input is not enough to sustain liquid water. In my opinion this is the most glaring error of his paper. Even in the glacial periods which have much lower solar energy absorbed there is still liquid water near the equator. Since there is much more water along the equator than there is land, even a snowball Earth can sustain life.
Water is also the largest unknown in the global warming debate. A warmer world means the atmosphere can hold more water vapor which can either add to the warming or tend to reduce the warming. The room for warming to increase albedo is not as large as the room to reduce albedo. There will always be ice and snow at the poles in winter which will persists into the summer. The normal weather patterns with more water vapor in the air means the chance of larger snow storms and rain storms increase, both reduce albedo. The warming can cause longer and more severe droughts, but droughts are over land and most of the droughts will be in the temperate latitudes. Droughts in the temperate zones have less impact on albedo, tend to increase atmospheric dust which can promote cooling and increase radiative cooling locally because of less water vapor.
Increased water vapor also tends to block a portion of the CO2 radiative impact at the surface. The reason most impact of increased CO2 should be at the poles and upper troposphere is because there is less competition with water vapor.
So while there is no guarantee that warming will not be enough to worried about, thanks to water the likelihood of catastrophic warming is reduced.
Note: The average albedo is more like 30% meaning the absorbed is 70%. So the references to albedo are reversed, but the idea remains the same.
Thursday, May 26, 2011
The Price of Fame - The New Legalities of Science
Scientists publish papers all the time, that's their job, publish or perish. Ground breaking papers published in big name journal rarely are really ground breaking. Most have some flaw that under more scrutiny is revealed that may lead to something or may not. If the work appears to be truly ground breaking, the scientist or team receive notoriety. If the paper is perceived to be ground breaking, touted as a new revelation, then found to be flawed, the fun begins.
The price, especially when the scientist or his work may sway policy, is law suits. There are a lot of law suits flying around in climate change right now. Many of the scientists involved are not accustom to the reality of fame, so their learning is entertaining and often very funny.
Micheal Mann, of IPCC "Hockey Stick" fame is currently center stage. He now works at the Penn State University. Most sports fans know the old Penn State, State Pen joke. Mann has a pending law suit with a Canadian over his character being defamed because of that joke. Mann also worked at the University of Virginia which is now being taken to court to release internal documents and e-mails related to Mann requested under the Freedom of Information Act.
A report critical of Mann's methods was withdrawn due to plagiarism. This report was authored by a student of a Doctor Wedgman who testified before the US Congress that the Mann "Hockey Stick" was flawed and the peer review process tainted by the limited number of experts in the field for reviewers. "Pal Review", as it has come to be known is letting less than stellar work slip through to the big name publications. That is the allegation anyway.
So now the internet is really buzzing with various blogs taking up positions. I have written my own opinion on the poor statistical choices of Dr. Mann. To error is human, so I am not one to kick a Mann down, but Mann is a serial offender. His confidence in his novel statistical insight is surprisingly intact despite many reminders that his conclusions are not very skillful. It is Mann's poor choices that have lead to calls for all climate science publication to be reviewed by third party statisticians.
Oddly, a great deal of climate scientists publicly defend Mann's less than stellar work. This is opening a huge can of worms.
Everyone knows that public officials have less protection from defamation laws in most countries, especially the United States. Public figures have more legal protection until they attempt to influence policy, which makes them legally on par with public officials. So the whole defamation games changes.
One of the liberal bloggers, Deep Climate, pressed hard to discredit the paper on Micheal Mann's "pal Review" process. The plagiarism issue championed by the liberal climate science community now opens the door wider to scrutinize their ethics. Tit for tat. One example of obvious plagiarism by the liberal side is the Menne et al paper that stole the work in progress of conservative blogger Anthony Watts. Watts and Menne came to an agreement so that the stole work was property attributed after the fact. While Watts may be satisfied, the plagiarism by employees of the United States Government of a private turned public citizen can lead to the mother of all federal cases. Menne et al committed a crime. Not a devastating crime, one that would not even require a written reprimand. However, the potential conspiracy to commit even a minor crime could be a much greater crime. "Pal Review" can easily become conspiracy which can be an extremely nasty legal situation.
Micheal Mann's poor statistical choices, since they were repeated in his following works and a co-authored paper with Dr. Eric Stieg, could be considered a conspiracy to improperly influence public policy. By gaining the level of fame they have and attempting to sway policy, their lives are no longer private.
So I predict, that the scat has not finished hitting the fan. No matter their intentions, quite a few climate scientists are about to enter the litigation zone.
The price, especially when the scientist or his work may sway policy, is law suits. There are a lot of law suits flying around in climate change right now. Many of the scientists involved are not accustom to the reality of fame, so their learning is entertaining and often very funny.
Micheal Mann, of IPCC "Hockey Stick" fame is currently center stage. He now works at the Penn State University. Most sports fans know the old Penn State, State Pen joke. Mann has a pending law suit with a Canadian over his character being defamed because of that joke. Mann also worked at the University of Virginia which is now being taken to court to release internal documents and e-mails related to Mann requested under the Freedom of Information Act.
A report critical of Mann's methods was withdrawn due to plagiarism. This report was authored by a student of a Doctor Wedgman who testified before the US Congress that the Mann "Hockey Stick" was flawed and the peer review process tainted by the limited number of experts in the field for reviewers. "Pal Review", as it has come to be known is letting less than stellar work slip through to the big name publications. That is the allegation anyway.
So now the internet is really buzzing with various blogs taking up positions. I have written my own opinion on the poor statistical choices of Dr. Mann. To error is human, so I am not one to kick a Mann down, but Mann is a serial offender. His confidence in his novel statistical insight is surprisingly intact despite many reminders that his conclusions are not very skillful. It is Mann's poor choices that have lead to calls for all climate science publication to be reviewed by third party statisticians.
Oddly, a great deal of climate scientists publicly defend Mann's less than stellar work. This is opening a huge can of worms.
Everyone knows that public officials have less protection from defamation laws in most countries, especially the United States. Public figures have more legal protection until they attempt to influence policy, which makes them legally on par with public officials. So the whole defamation games changes.
One of the liberal bloggers, Deep Climate, pressed hard to discredit the paper on Micheal Mann's "pal Review" process. The plagiarism issue championed by the liberal climate science community now opens the door wider to scrutinize their ethics. Tit for tat. One example of obvious plagiarism by the liberal side is the Menne et al paper that stole the work in progress of conservative blogger Anthony Watts. Watts and Menne came to an agreement so that the stole work was property attributed after the fact. While Watts may be satisfied, the plagiarism by employees of the United States Government of a private turned public citizen can lead to the mother of all federal cases. Menne et al committed a crime. Not a devastating crime, one that would not even require a written reprimand. However, the potential conspiracy to commit even a minor crime could be a much greater crime. "Pal Review" can easily become conspiracy which can be an extremely nasty legal situation.
Micheal Mann's poor statistical choices, since they were repeated in his following works and a co-authored paper with Dr. Eric Stieg, could be considered a conspiracy to improperly influence public policy. By gaining the level of fame they have and attempting to sway policy, their lives are no longer private.
So I predict, that the scat has not finished hitting the fan. No matter their intentions, quite a few climate scientists are about to enter the litigation zone.
Wednesday, April 6, 2011
So Where Did the Back Radiation Go?
Balancing the radiation budget for the Earth is an evolving process. I guess when when the climate scientist Keith Trenberth noticed there was missing heat the accountants had to change their accounting methods. The changes make for some silly but interesting conversations with the pro global warming crowd.
The change for the incoming or down welling longwave radiation are pretty dramatic!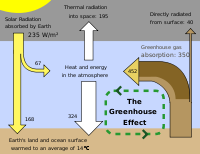
In this cartoon the big white arrow is a huge amount of longwave radiation warming the Earth. There is a tiny little white arrow showing longwave radiation cooling the Earth. This is posted in Wikipedia under Global Warming.
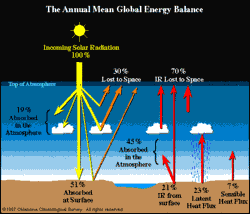
This one doesn't have a big white arrow. It is posted under Earth Radiation Budget in Wikipedia.
So if you are discussing the radiation budget and warming, which cartoon do you use? Just looking at them, which one is more confusing? Are killer clouds shooting huge amounts of energy at us on the surface or are they just acting like a blanket so we don't get so cold at night? If you are trying to sell the fear of global warming, which cartoon would you use?
The change for the incoming or down welling longwave radiation are pretty dramatic!

In this cartoon the big white arrow is a huge amount of longwave radiation warming the Earth. There is a tiny little white arrow showing longwave radiation cooling the Earth. This is posted in Wikipedia under Global Warming.

This one doesn't have a big white arrow. It is posted under Earth Radiation Budget in Wikipedia.
So if you are discussing the radiation budget and warming, which cartoon do you use? Just looking at them, which one is more confusing? Are killer clouds shooting huge amounts of energy at us on the surface or are they just acting like a blanket so we don't get so cold at night? If you are trying to sell the fear of global warming, which cartoon would you use?
Tuesday, February 8, 2011
Greenhouse Gases and Climate Sensitivity - A Simple Analogy?
In the late 19th century Svante Arrhenius proposed a theory of global warming where carbon dioxide and water vapor increases in the atmosphere would warm the Earth like a "Greenhouse". The greenhouse analogy was a simple way to explain the molecular level interactions of radiant heat energy and atmospheric gases. Like most analogies, the Greenhouse Effect was less than perfect. In order to produce a better analogy, many have provided simple descriptions of how carbon dioxide, water vapor and trace gases interact with outgoing heat radiation to produce global scale warming, then relate that processes to other analogies like blankets and tanks. For some reason, improved analogies have done little to improve understanding of what happens in the atmosphere. Even well educated physicists are still challenging the concept of global warming by molecular interaction with heat radiation. The Book "Slaying the Sky Dragon - Death to the Greenhouse Theory" by Schreuder and O'Sullivan is a recent example of the complete misunderstanding of the relatively simple process of how Earth's atmosphere regulates temperature.
Since the space age there are plenty of examples of what happens to the surface temperatures of objects with no atmosphere when exposed to periodic sunlight. They warm with the light and cool when there is no light. The unregulated temperature swings are huge by Earth standards. The moon for example, has day temperatures as high as 123 degrees C and night temperatures as low as -233 degrees C. Even in the vacuum of space, heat flows from warm objects to cool objects. The heat flows via radiation. Electromagnetic radiation, some visible like sunlight and some invisible to the human eye. How quickly the heat flows for these bodies in space is well understood thanks to the work of many 19th century scientists.
There are two types of objects in space, those that produce electromagnetic radiation (heat) and those that do not. The Sun is an example of a radiation producer and the moon an example of one that does not. The Stefan-Boltzmann equation describes the rate that non heat producing bodies, called black bodies, emit heat energy to the cold reservoir of space.
The coldest temperature there is, called absolute zero, is -273.15 degrees C or zero degrees Kelvin (K). This is the theoretical temperature where all atomic motion stops. Motion is a form of energy and all energy can produce heat. The simplest atom is a positively charged nucleus (proton) orbited by negatively charged electron. Theoretically, at absolute zero, the electron stops orbiting the proton. Since no one knows what actually happens should that orbiting electron stop moving, absolute zero is a theory. We can save that discussion for another day and just admit that the theory of absolute zero is a good one.
During the day, the lunar surface is warmed by radiant heat from the sun. This is one point no one disagrees with. It is obvious that the sun warms people and things. When the sun is not present people and things cool which is also obvious. So sticking with the obvious, how do we keep from becoming too cool? By insulating ourselves to reduce the rate of cooling, cuddling up with something warm or generating heat to warm ourselves. The moon doesn't have any of those options so its surface just cools when not in sun light. It does not cool to absolute zero though. Since the moon is pretty big, it takes time to lose all its heat and the colder it gets the slower it loses heat. So the moon makes a good laboratory for us Earthlings to study to find out how much we would cool if there was no atmosphere.
The average temperature of the moon is about -23 degrees C. By looking at the difference in the thermal mass of the Earth and the thermal mass of the moon, it can be calculated that the Earth's average temperature would be about -18 degrees C if we had no atmosphere. We will leave that calculation for another day, but despite all the uncertainties involved, that is a pretty solid estimate. The actual average temperature of the Earth with atmosphere is about 33 degrees warmer than it would be without an atmosphere. There are all sorts of uncertainties involved with this determination as well, but it is a pretty solid estimate. So unless someone really wants to pic nits, the atmosphere reduces the rate of Earth's cooling and heating to maintain a temperature roughly 33 degrees C greater than it would be if we did not have an atmosphere.
In sunlight, the Earth does not warm as much as the moon because of really two things, reflectivity and thermal mass. Reflectivity, called albedo, is fairly simple to explain. If you walk barefoot on a black top road in the sun you will notice that the road is a lot warmer than the sand that may be beside the road. Darker surfaces absorb more heat than lighter colored surfaces. Black is less reflective of light than white. The Earth has white clouds, snow and other colored surfaces than black that absorb less light energy. The moon is also not black or we would not be able to see it so easily in the night sky.
Thermal mass is a little harder to explain, but certain objects take longer to heat and/or cool than others. Solid things like land masses warm more quickly than liquid things like oceans. Gaseous things like air warm much more quickly because air has very little thermal mass. Anything that has mass, has thermal mass. Thermal mass is how much heat something can hold. So in general the more mass something has, the more heat it can hold, the more heat something can hold, the longer it takes to transfer heat to it relative to objects that have less thermal mass. There is a difference between pure mass and thermal mass. Seventy percent of the Earth's surface is water which has a very high thermal mass. Land area has thermal mass that varies considerably, but is less than water as far as the Earth's surface is concerned. So the oceans heat and cool slower than the land. This is obvious to anyone that lives near an ocean or a large lake.
In the day, reflectivity and thermal mass regulate how quickly the Earth's surface warms. At night reflectivity is replaced by emissivity. Emissivity describes how quickly heat can flow through a gas mixture. This is harder for many to understand since we can't see radiant heat and for the most part, can't see the gases interacting with the heat flow. Luckily, clouds are easy to see and are part of what changes emissivity. Most people have noticed how a blanket of clouds at night tend to keep the temperatures warmer than on a clear night. The clouds slow down the flow of heat from the surface. They don't stop the flow of heat. They don't reverse the flow of heat. They just slow down the flow of heat, just like a blanket slows down how quickly we lose heat. So the blanket analogy is pretty good for a basic understanding of how atmospheric gases "blanket" the Earth to regulate temperatures.
Even on a clear night things are happening to regulate temperature that we can't see. Think of it as a very thin blanket if you must, but this is where the neat stuff is happening on a molecular scale. Some describe it as down welling heat or back radiation, but it is not. The direction of heat flow never changes, only the rate of flow. That is why the tub, dam or sink analogies were proposed. The heat flow is like a faucet or stream flowing into a basin with a drain or overflow. If the flow in is equal to the flow out, the water level remains the same. Carbon dioxide is like hair building up in the drain or a beaver sticking a log in the overflow. If nothing else changes, the water level will rise. Molecules made of different elements temporarily can capture a tiny packet of heat energy called a photon and release it quickly. The molecules release their energy captive in random directions. The molecules don't aim the packets back at Earth. The molecules don't fly back down to Earth to release their hostage. The molecules just momentarily impede the progress of the packets on their journey to space. The more they impede the flow the higher the water gets.
Added 2/10/11: In the atmosphere the water level is like the lapse rate. The lapse rate is the rate of decrease of temperature with height. I may expand on this later.
So probably the best analogy for many people would be a highway patrol car with its lights on parked beside the interstate. People slow down to avoid getting a ticket, traffic starts to get a little congested and there is no obvious reason why until you see the cop car.
All of these analogies are lacking in some form or the other, since they only look at a small part of the picture. They neglect the other things that happen because something else is happening. These are known as feedbacks. If you see the traffic congestion and get off the road to have lunch, you just provided negative feedback to the traffic situation. In other words you did not add to the problem. If you slow down because you see some traffic congestion or you are a lookie lou, you have a positive feedback to the traffic situation. If you keep honking your horn, you are positively a pain in the butt feedback to the traffic situation. (Sorry, I could not resist.)
Water vapor is a lookie lou. Warmer air can hold more water vapor and water vapor is a packet grabbing molecule. Water vapor can also be the driver opting for lunch since just because warmer air can hold more water vapor doesn't mean the water vapor wants to be held. And water vapor is a pain in the butt because it forms various kinds of clouds that may provide positive or negative feedback.
Thermal mass is a pretty good driver that goes with the flow most of the time. Like any other driver on "your" road, thermal mass can be a pain in the butt. The deep oceans are a huge thermal reservoir that can be a little bit irritable. As long as another driver does not aggravate them, they warm gradually and cool gradually. All good drivers know that some time, some one is going to do something stupid and hack you off. In climate terms this is called internal variability. Most of the time, good drivers regain their composure rather quickly and start doing the good driver thing again. This would be short term variability that averages out quickly and has little if any impact on long term climate.
Even good drivers can only put up with so much crap, so they may start messing with the stupid drivers for a while until they get whatever measure of satisfaction they need at the time. This would be like decadal or multi-decadal internal variability. They seem to have some impact on climate, but it looks like they may average out over all.
On rare occasion, a couple of the good drivers may go postal and start taking it out on everyone. This would be climate shifts that can last for decades. These climate shifts probably have an impact on climate, but we really are not sure because we don't have enough data to know for sure.
So to conclude:
Carbon dioxide is a traffic cop with lights on slowing the heat traffic down a little.
Water vapor is most of the time a lookie lou slowing things down more because of the traffic cop.
Thermal mass, aka ocean heat content, is a good driver staying out of trouble most of the time.
Those three things really should not be a matter of debate.
The question is how many cop cars are going to show up, will the guys behind the lookie lou start laying on their horns and will that drive the good driver postal?
Like pretty much everything I have on this blog I may be back to update things :)
Added 2/10/11
If you want to get a more detailed explanation of back radiation or downward long wave radiation you can go to the blog, Science of Doom. They have a multi-part post on The Amazing Case of "Back Radiation" It is very comprehensive, as in very long and somewhat technical, though not a bad read really. I have no arguments with anything in their post other, than I feel that the terms back radiation and downward longwave radiation and down welling, needlessly complicate the situation making some believe that the second law of thermodynamics is being violated. Their description kinda goes against the zeroth law of thermodynamics which was added so that temperature could be interchanged with heat flow to simplify understanding of the laws of thermodynamics.
KISS or Keep It Simple Stupid, it the first thing most thermodynamics professors teach, which is why I find the concept of reversed, cold to hot, heat flow needlessly over complicated when the direction of flow, other than on a very small atomic level, does not change.
Should you read their posts you will learn a lot of neat stuff. Hopefully, you will pick up on how your frame of reference changes what your perception will be. So an Earth bound observer with a neat tool called a pyrometer which measures temperature, would be lead to believe that infrared radiation is flowing back at him while in actuality he is just measuring changes in rate of traffic flow :)
Since the space age there are plenty of examples of what happens to the surface temperatures of objects with no atmosphere when exposed to periodic sunlight. They warm with the light and cool when there is no light. The unregulated temperature swings are huge by Earth standards. The moon for example, has day temperatures as high as 123 degrees C and night temperatures as low as -233 degrees C. Even in the vacuum of space, heat flows from warm objects to cool objects. The heat flows via radiation. Electromagnetic radiation, some visible like sunlight and some invisible to the human eye. How quickly the heat flows for these bodies in space is well understood thanks to the work of many 19th century scientists.
There are two types of objects in space, those that produce electromagnetic radiation (heat) and those that do not. The Sun is an example of a radiation producer and the moon an example of one that does not. The Stefan-Boltzmann equation describes the rate that non heat producing bodies, called black bodies, emit heat energy to the cold reservoir of space.
The coldest temperature there is, called absolute zero, is -273.15 degrees C or zero degrees Kelvin (K). This is the theoretical temperature where all atomic motion stops. Motion is a form of energy and all energy can produce heat. The simplest atom is a positively charged nucleus (proton) orbited by negatively charged electron. Theoretically, at absolute zero, the electron stops orbiting the proton. Since no one knows what actually happens should that orbiting electron stop moving, absolute zero is a theory. We can save that discussion for another day and just admit that the theory of absolute zero is a good one.
During the day, the lunar surface is warmed by radiant heat from the sun. This is one point no one disagrees with. It is obvious that the sun warms people and things. When the sun is not present people and things cool which is also obvious. So sticking with the obvious, how do we keep from becoming too cool? By insulating ourselves to reduce the rate of cooling, cuddling up with something warm or generating heat to warm ourselves. The moon doesn't have any of those options so its surface just cools when not in sun light. It does not cool to absolute zero though. Since the moon is pretty big, it takes time to lose all its heat and the colder it gets the slower it loses heat. So the moon makes a good laboratory for us Earthlings to study to find out how much we would cool if there was no atmosphere.
The average temperature of the moon is about -23 degrees C. By looking at the difference in the thermal mass of the Earth and the thermal mass of the moon, it can be calculated that the Earth's average temperature would be about -18 degrees C if we had no atmosphere. We will leave that calculation for another day, but despite all the uncertainties involved, that is a pretty solid estimate. The actual average temperature of the Earth with atmosphere is about 33 degrees warmer than it would be without an atmosphere. There are all sorts of uncertainties involved with this determination as well, but it is a pretty solid estimate. So unless someone really wants to pic nits, the atmosphere reduces the rate of Earth's cooling and heating to maintain a temperature roughly 33 degrees C greater than it would be if we did not have an atmosphere.
In sunlight, the Earth does not warm as much as the moon because of really two things, reflectivity and thermal mass. Reflectivity, called albedo, is fairly simple to explain. If you walk barefoot on a black top road in the sun you will notice that the road is a lot warmer than the sand that may be beside the road. Darker surfaces absorb more heat than lighter colored surfaces. Black is less reflective of light than white. The Earth has white clouds, snow and other colored surfaces than black that absorb less light energy. The moon is also not black or we would not be able to see it so easily in the night sky.
Thermal mass is a little harder to explain, but certain objects take longer to heat and/or cool than others. Solid things like land masses warm more quickly than liquid things like oceans. Gaseous things like air warm much more quickly because air has very little thermal mass. Anything that has mass, has thermal mass. Thermal mass is how much heat something can hold. So in general the more mass something has, the more heat it can hold, the more heat something can hold, the longer it takes to transfer heat to it relative to objects that have less thermal mass. There is a difference between pure mass and thermal mass. Seventy percent of the Earth's surface is water which has a very high thermal mass. Land area has thermal mass that varies considerably, but is less than water as far as the Earth's surface is concerned. So the oceans heat and cool slower than the land. This is obvious to anyone that lives near an ocean or a large lake.
In the day, reflectivity and thermal mass regulate how quickly the Earth's surface warms. At night reflectivity is replaced by emissivity. Emissivity describes how quickly heat can flow through a gas mixture. This is harder for many to understand since we can't see radiant heat and for the most part, can't see the gases interacting with the heat flow. Luckily, clouds are easy to see and are part of what changes emissivity. Most people have noticed how a blanket of clouds at night tend to keep the temperatures warmer than on a clear night. The clouds slow down the flow of heat from the surface. They don't stop the flow of heat. They don't reverse the flow of heat. They just slow down the flow of heat, just like a blanket slows down how quickly we lose heat. So the blanket analogy is pretty good for a basic understanding of how atmospheric gases "blanket" the Earth to regulate temperatures.
Even on a clear night things are happening to regulate temperature that we can't see. Think of it as a very thin blanket if you must, but this is where the neat stuff is happening on a molecular scale. Some describe it as down welling heat or back radiation, but it is not. The direction of heat flow never changes, only the rate of flow. That is why the tub, dam or sink analogies were proposed. The heat flow is like a faucet or stream flowing into a basin with a drain or overflow. If the flow in is equal to the flow out, the water level remains the same. Carbon dioxide is like hair building up in the drain or a beaver sticking a log in the overflow. If nothing else changes, the water level will rise. Molecules made of different elements temporarily can capture a tiny packet of heat energy called a photon and release it quickly. The molecules release their energy captive in random directions. The molecules don't aim the packets back at Earth. The molecules don't fly back down to Earth to release their hostage. The molecules just momentarily impede the progress of the packets on their journey to space. The more they impede the flow the higher the water gets.
Added 2/10/11: In the atmosphere the water level is like the lapse rate. The lapse rate is the rate of decrease of temperature with height. I may expand on this later.
So probably the best analogy for many people would be a highway patrol car with its lights on parked beside the interstate. People slow down to avoid getting a ticket, traffic starts to get a little congested and there is no obvious reason why until you see the cop car.
All of these analogies are lacking in some form or the other, since they only look at a small part of the picture. They neglect the other things that happen because something else is happening. These are known as feedbacks. If you see the traffic congestion and get off the road to have lunch, you just provided negative feedback to the traffic situation. In other words you did not add to the problem. If you slow down because you see some traffic congestion or you are a lookie lou, you have a positive feedback to the traffic situation. If you keep honking your horn, you are positively a pain in the butt feedback to the traffic situation. (Sorry, I could not resist.)
Water vapor is a lookie lou. Warmer air can hold more water vapor and water vapor is a packet grabbing molecule. Water vapor can also be the driver opting for lunch since just because warmer air can hold more water vapor doesn't mean the water vapor wants to be held. And water vapor is a pain in the butt because it forms various kinds of clouds that may provide positive or negative feedback.
Thermal mass is a pretty good driver that goes with the flow most of the time. Like any other driver on "your" road, thermal mass can be a pain in the butt. The deep oceans are a huge thermal reservoir that can be a little bit irritable. As long as another driver does not aggravate them, they warm gradually and cool gradually. All good drivers know that some time, some one is going to do something stupid and hack you off. In climate terms this is called internal variability. Most of the time, good drivers regain their composure rather quickly and start doing the good driver thing again. This would be short term variability that averages out quickly and has little if any impact on long term climate.
Even good drivers can only put up with so much crap, so they may start messing with the stupid drivers for a while until they get whatever measure of satisfaction they need at the time. This would be like decadal or multi-decadal internal variability. They seem to have some impact on climate, but it looks like they may average out over all.
On rare occasion, a couple of the good drivers may go postal and start taking it out on everyone. This would be climate shifts that can last for decades. These climate shifts probably have an impact on climate, but we really are not sure because we don't have enough data to know for sure.
So to conclude:
Carbon dioxide is a traffic cop with lights on slowing the heat traffic down a little.
Water vapor is most of the time a lookie lou slowing things down more because of the traffic cop.
Thermal mass, aka ocean heat content, is a good driver staying out of trouble most of the time.
Those three things really should not be a matter of debate.
The question is how many cop cars are going to show up, will the guys behind the lookie lou start laying on their horns and will that drive the good driver postal?
Like pretty much everything I have on this blog I may be back to update things :)
Added 2/10/11
If you want to get a more detailed explanation of back radiation or downward long wave radiation you can go to the blog, Science of Doom. They have a multi-part post on The Amazing Case of "Back Radiation" It is very comprehensive, as in very long and somewhat technical, though not a bad read really. I have no arguments with anything in their post other, than I feel that the terms back radiation and downward longwave radiation and down welling, needlessly complicate the situation making some believe that the second law of thermodynamics is being violated. Their description kinda goes against the zeroth law of thermodynamics which was added so that temperature could be interchanged with heat flow to simplify understanding of the laws of thermodynamics.
KISS or Keep It Simple Stupid, it the first thing most thermodynamics professors teach, which is why I find the concept of reversed, cold to hot, heat flow needlessly over complicated when the direction of flow, other than on a very small atomic level, does not change.
Should you read their posts you will learn a lot of neat stuff. Hopefully, you will pick up on how your frame of reference changes what your perception will be. So an Earth bound observer with a neat tool called a pyrometer which measures temperature, would be lead to believe that infrared radiation is flowing back at him while in actuality he is just measuring changes in rate of traffic flow :)
Saturday, January 29, 2011
More About Climate Sensitivity
This also is a work in progress were comments are welcome. Since my cold is getting better, this will probably be place on a back burner soon.
Climate Sensitivity is 3 Degrees is a post on Dr. James Annan's blog about the issue of Climate Sensitivity. It is a good summary of the situation, but I would like to add my uniformed two cents worth.
The dry air sensitivity to a doubling of CO2 is about 1 degrees C. I give a range of 1.0 to 1.6 degrees C to include what "I" believe is the originator of the greenhouse theory's, Arrhenius' estimate of minimum climate sensitivity. The uncertainty in specifying climate sensitivity is the response of water vapor which is "the" predominate greenhouse gas.
The term "greenhouse effect" is not that good a description of how CO2 variations in the atmosphere works. Heat flows by conduction, convection and radiation. A real greenhouse impacts all three methods of heat transfer and Arrhenius' "Greenhouse Effect" deals only with radiative heat transfer. Convection and to a lesser extent, conduction are still a part of the heat transfer in the atmosphere up to a layer called the tropopause in the atmosphere. The layer we live in, the troposphere, has a lot of convection, as in rising air masses, falling air masses, precipitation and generally air moving around. There is also variations in solar radiation converted into heat caused by reflection by snow, clouds and dust in the air. The greenhouse effect applies only to outgoing heat radiation called long wave radiation or Infrared radiation. Since things change in the atmosphere, climate sensitivity changes somewhat and the estimates of climate sensitivity would of course be somewhat difficult to nail down. The more we learn the better the estimates will become. Still these estimates will never "guarantee" that climate sensitivity remains exactly in the range we estimate.
Models of the Earth's climate are tools to help understand what is going on, which can help predict what will happen. No model is totally accurate, so the results of several models and various model runs are used determine best guesses. Using different statistical approaches, these best guesses can provide a likelihood range of climate sensitivity that is narrower than indicated by just averaging out the guesses.
Model output is dependent on model input, so the more that is understood about the interactions of the atmosphere, the better the model results should be. Simplicity is a wonderful thing, so keeping it simple in the models is a desired thing. One person's simple is not the same as another person's simple which is where I get into a little trouble with the guys that make the models.
Natural variability is one thing the models do not do a good job of using. Some natural variability is fairly well understood and can be calculated or measured. Other kinds of natural variability is poorly understood and the main source of the uncertainty. Water vapor is the main pain in the butt when it comes to fine tuning the models.
Since the dry air 2xCO2 sensitivity is pretty much agreed upon, the poles of the planet should show a more predictable response to 2xCO2. In a perfect world, warming at both the Arctic and Antarctic caused by CO2 would be somewhat equal or at least discernible in the instrumental temperature records. For a variety of reasons it is not. Before you stop reading, this doesn't prove or disprove anything other than our temperature records at the poles are less than perfect. To improve our understanding of the temperature average at the Antarctic, a recent paper fine tuned some statistical methods to reconstruct a temperature record for the past fifty years for the Antarctic. This discussion of the paper and the paper it challenged is here. The results is that the Antarctic continent maybe warming or may not.
There is definitely more warming at the western Antarctic peninsular than anywhere else which is not a good indication that the warming is due to increased CO2. It does indicate that natural variability, or at least unknown variability, is more a factor than CO2 increase.
In the Arctic, there is a lot of warming. A recent study using ocean sediment cores determined "unprecedented warming" due to Atlantic waters of 3.5 degrees C.
These two extreme examples illustrate our lack of understanding of what is happening in our biosphere. Natural oscillations in our climate patterns complicate our analysis of the impact of 2xCO2.
Natural oscillations are kinda sorta different than natural climate variability. These oscillation move heat energy around where that change in energy can impact global temperature through other processes. The oscillations do not add or remove heat. A cold front, for example, moves air with less heat content to an area where the air has more heat content. When that colder air meets warmer air you normally get some kind of precipitation which does change the heat content of the air. Without the precipitation, air is just being moved around. Now that is not a perfect analogy, there is heat transfer without precipitation, there is just a heck of a lot more with precipitation due to the latent heat change in the air. Sensible heat change, what we can feel, is about 1/4 of the total heat change when moisture is removed from the air. This year there is a whole lot of precipitation going on as the floods in Australia and Brazil indicate, plus record snowfalls in the Northeastern US and Britain.
Precipitation accounts for a very large amount of heat transfer. The average Atlantic hurricane transfers about 600 trillion Watts per day from the troposphere to the low stratosphere. I lost the link to that estimate by NASA, but using 2260 Kilojoules per Kilogram of water, an average storm diameter of roughly 1250 kilometers and an average rainfall per day over that area of roughly 1 centimeter, you should get in that ballpark. Then there is other heat transfer like mixing of the ocean thanks to the waves which involves less energy but has an impact on sea surface temperatures. While 600 trillion watts per day is a big number, it is small in comparison to daily solar irradiation that is on the order of Zeta Watts (10^21). Then each year approximately 505,000 cubic kilometers of rain falls per year around the globe. There is 1x10^12 liters(kilograms of water)per cubic kilometer which yields 5.05x10^17 kilograms of rain at 2260 joules per kilogram yields 11.4x10^20 joules or about 1.14 zetajoules. Phew! These are getting to be big numbers!
One zetawatt is nothing compared to approximately 5500 zetawatts per year of solar irradiation at the top of the atmosphere(TOA). Rain though is not at the TOA, it is part of the turbulent climate activity at the bottom of the atmosphere where we live. So to get some kinda perspective the area of the Earth's surface is about 5.1x10^8 Kilometers squared which is 5.1x10^14 meters squared. Combining the two, precipitation accounts for about 2.2x10^6 Joules per meter squared per year of heat transfer, which is about 0.1 watt-hr/meter squared.
In addition to heat loss due to precipitation there is also energy reflected by the clouds associated with the weather systems that produce the rain. I haven't found a good rule of thumb for cloud cover per watt of heat loss due to precipitation. So I will give it a shot. Back to the average hurricane estimate we have roughly 1250 kilometer diameter of cloud cover for 600 trillion watts per day. The area of the storm is about 1.2 million kilometers squared which is 1.2 x 10^12 meters squared. That should give me 2 meters per watt-day or 0.08 meters per watt hour. Let's just round that off to 0.1 since it is my guesstimation. Since the tops of clouds are nice and bright white they should reflect nearly all the short wave radiation. The average incident radiation for the Earth, per the World Meteorological Organization for sunshine duration, is 120 watts per meter squared. For diurnal illumination I will assume 60 watts per square meter. That would yield about 6 watts per square meter reflected radiation. So reflected radiation due to cloud cover should be a good order of magnitude greater than the heat loss due to latent cooling of precipitation.
This rough rule of thumb is pretty crude, but it may be useful in figuring out negative cloud feed back based on precipitation change. Clouds are considered to be a positive feedback since they block outgoing radiation especially in dry environments. Winter clouds do tend to keep temperatures warmer as long as there is no significant precipitation associated with the cloud cover. Storm clouds are a different critter. They tend to be a negative feedback because of the associated convection. (This is a point of dispute, the whole reason I am considering this rule of thumb.)
The next question is how much more negative is the feedback compared to typical positive feedback? There is a lot of ongoing research in this area. The Tropical Warm Pool International Cloud Experiment is one group I know of. The problem is complex enough that I have not seen any definitive results yet.
This is kind of how it goes. The Earth is a gray body that radiates heat into space based on the Stefan-Boltzmann equation, W = e*delta*T^4, where W is watts per meter squared, e is the emissivity, delta is Stefan's constant 5.67x10^8 Joules/(second*meters^2*K^4) and T is absolute temperature in degrees K. So the right side of the equation is in Joules per second per meter squared which is the same as Watts per meter squared. The dimensionless term e for a black body is about 0.924 according to the Wein approximation. The Earth is not a true black body so the average emissivity is approximately 0.68 and typical cloud emissivity is thought to be about 0.5, lot of approximates and abouts aren't there? Here is a paper about one approach to the problem, Spectral Cloud Emissivities...
The problem is that clouds are part of the Earth and will radiate heat to space just like the planet surface. That radiation rate depends upon the same variables only at the top of the clouds the emissivity is approximately 0.924 (it is this emissivity the 2XCO2 will most greatly impact). Below the cloud, the surface radiation is being blocked by the clouds with an emissivity that varies. Since heat can flow due to conduction and convection, active moving clouds mix the heat through the cloud body negating some portion of the apparent lower emissivity. Blankets and insulation work because there is dead or virtually not moving air to reduce heat transfer due to conduction, convection and radiation. Those winter clouds that keep things warmer than you would think are like a blanket. They are just laying there nice a quiet. If he wind kicks up to 20 knots it is more than just wind chill that makes it colder, it is the clouds mixing temperatures which allows heat to escape also.
With a planet, energy in is pretty much equal to energy out at the top of the atmosphere. That makes it easier to get a guess how much the difference is between the local radiation balance of an area with precipitation cloud cover. Rain clouds block or reflect, most of the incoming radiation and about half of the outgoing radiation. So a good first guess is that rain clouds produce about 2 to 3 watts per meter squared of negative feedback. Note that is not all clouds, only clouds with precipitation.
If my rule of thumb happens to be in the ballpark, changes in precipitation would be a factor in global temperature change. Fine tuning the rule of thumb is bit more difficult.
There are a number of scientists and groups studying the nature of cloud impact on global climate. So this feeble attempt of mine has been done more accurately than I have in the past and will be further fine tuned in the future, I am sure. I rarely have truly original ideas, so here is very little likelihood that there is anything earth shattering here. It is a reasonable explanation of the complexity of cloud feedback.
In case you were wondering, the positive feedback of clouds has to be considered as well and it is more difficult track changes over time because of the lack of precipitation. So here is a brief look at positive cloud feedback from my perspective.
For positive feedback, clouds would have a rather low emissivity, ~0.5, and fairly high diffusion. How much light the clouds let through is an indication of how much solar radiation they are letting through. Simply, positive feedback cloud block more outgoing radiation than incoming.
This is more difficult to "see" because the infrared range of light outgoing is not in our visible spectrum. Patchy cirrus clouds let in a lot of visible light, so it would seem they would let out just as much infrared. which is not really the case.
At higher latitudes, where the air is typically drier, these clouds have a positive feedback or at least indicate the possibility of positive feedback. That sounds like I am hedging my bet, but there is a little logic to my reasoning.
Greenhouse gases have a higher impact in areas of lower relative or specific humidity. A desert is a good example. With clear skies, daytime temperatures can be over 100 degrees F and nighttime temperatures drop below 50 degrees F. With cloud cover that range can drop to below 100 F in the day and over 50 degrees F at night. The same cloud conditions in the humid tropics much less dramatic temperature wise because there is not as large a swing in emissivity which can be indicated by the specific humidity.
That may sound confusing, but you have to remember that water vapor is "the" main greenhouse gas. Water vapor is responsible for somewhere between 60% and 80% of the greenhouse effect while trace elements are responsible for between 6% and 15% of the greenhouse effect on a global average. As water vapor decreases, the well mixed trace gases remain about the same, so their percentage impact increases in a dry air environment. So cloud location impacts its positive feedback, high latitude clouds and clouds over desert areas produce more positive feedback than they would over the tropics.
Changes in average cloud cover can be an indicator of 2XCO2 feedback, but the local conditions where the increased cloud cover occurs determines how strong the feedback is. That is about as simple as I can explain it. Local dew point temperatures use to determine relative and specific humidity are probably the most inaccurate temperature measurements recorded. Satellite measurements are more accurate, but coverage and the length of records limit their usefulness.
Precipitation records, while not totally accurate, are long enough and have good enough accuracy to be useful. In addition, rainfall reconstructions tend to be more accurate than temperature reconstructions because rainfall has a greater impact on most proxies than temperature.

The US and Global Precipitation Anomalies to the left are from a US government site which I will include a link to soon. The Data for the US appears to be more complete so it is likely that a comparison to US temperature anomalies would be appropriate for fine tuning the rule of thumb. A quick eyeball indicates a correlation between temperature and precipitation trends. A more intelligent statistical approach will be needed to see if and how much correlation exists.
As I mentioned, the rule of thumb is crude at this point. Comparisons to other cloud/precipitation studies shows a variety of results on the magnitude and sign of cloud feedback.
My conclusion so far is to reconstruct past climate change and to provide model input to predict future climate change, precipitation change by region would appear to be an important factor. A reasonable rule of thumb for energy change associated with precipitation would help fine tune the model skill. Regional based models, where the accuracy of instrumental measurements can be more easily determined, should be better suited to determining a precipitation variation input for general climate models.
2/11/11
Just to add a few thoughts before I forget them. Low latitude precipitation reconstructions agree well with oscillation variations, but mid and high latitude reconstructions are more difficult to attribute to a particular oscillation due to the interaction of various oscillation with each other. Since high latitude temperature variation is much greater than tropical, it would be very easy to jump to wrong conclusions should precipitation lag/lead temperature.
Climate Sensitivity is 3 Degrees is a post on Dr. James Annan's blog about the issue of Climate Sensitivity. It is a good summary of the situation, but I would like to add my uniformed two cents worth.
The dry air sensitivity to a doubling of CO2 is about 1 degrees C. I give a range of 1.0 to 1.6 degrees C to include what "I" believe is the originator of the greenhouse theory's, Arrhenius' estimate of minimum climate sensitivity. The uncertainty in specifying climate sensitivity is the response of water vapor which is "the" predominate greenhouse gas.
The term "greenhouse effect" is not that good a description of how CO2 variations in the atmosphere works. Heat flows by conduction, convection and radiation. A real greenhouse impacts all three methods of heat transfer and Arrhenius' "Greenhouse Effect" deals only with radiative heat transfer. Convection and to a lesser extent, conduction are still a part of the heat transfer in the atmosphere up to a layer called the tropopause in the atmosphere. The layer we live in, the troposphere, has a lot of convection, as in rising air masses, falling air masses, precipitation and generally air moving around. There is also variations in solar radiation converted into heat caused by reflection by snow, clouds and dust in the air. The greenhouse effect applies only to outgoing heat radiation called long wave radiation or Infrared radiation. Since things change in the atmosphere, climate sensitivity changes somewhat and the estimates of climate sensitivity would of course be somewhat difficult to nail down. The more we learn the better the estimates will become. Still these estimates will never "guarantee" that climate sensitivity remains exactly in the range we estimate.
Models of the Earth's climate are tools to help understand what is going on, which can help predict what will happen. No model is totally accurate, so the results of several models and various model runs are used determine best guesses. Using different statistical approaches, these best guesses can provide a likelihood range of climate sensitivity that is narrower than indicated by just averaging out the guesses.
Model output is dependent on model input, so the more that is understood about the interactions of the atmosphere, the better the model results should be. Simplicity is a wonderful thing, so keeping it simple in the models is a desired thing. One person's simple is not the same as another person's simple which is where I get into a little trouble with the guys that make the models.
Natural variability is one thing the models do not do a good job of using. Some natural variability is fairly well understood and can be calculated or measured. Other kinds of natural variability is poorly understood and the main source of the uncertainty. Water vapor is the main pain in the butt when it comes to fine tuning the models.
Since the dry air 2xCO2 sensitivity is pretty much agreed upon, the poles of the planet should show a more predictable response to 2xCO2. In a perfect world, warming at both the Arctic and Antarctic caused by CO2 would be somewhat equal or at least discernible in the instrumental temperature records. For a variety of reasons it is not. Before you stop reading, this doesn't prove or disprove anything other than our temperature records at the poles are less than perfect. To improve our understanding of the temperature average at the Antarctic, a recent paper fine tuned some statistical methods to reconstruct a temperature record for the past fifty years for the Antarctic. This discussion of the paper and the paper it challenged is here. The results is that the Antarctic continent maybe warming or may not.
There is definitely more warming at the western Antarctic peninsular than anywhere else which is not a good indication that the warming is due to increased CO2. It does indicate that natural variability, or at least unknown variability, is more a factor than CO2 increase.
In the Arctic, there is a lot of warming. A recent study using ocean sediment cores determined "unprecedented warming" due to Atlantic waters of 3.5 degrees C.
These two extreme examples illustrate our lack of understanding of what is happening in our biosphere. Natural oscillations in our climate patterns complicate our analysis of the impact of 2xCO2.
Natural oscillations are kinda sorta different than natural climate variability. These oscillation move heat energy around where that change in energy can impact global temperature through other processes. The oscillations do not add or remove heat. A cold front, for example, moves air with less heat content to an area where the air has more heat content. When that colder air meets warmer air you normally get some kind of precipitation which does change the heat content of the air. Without the precipitation, air is just being moved around. Now that is not a perfect analogy, there is heat transfer without precipitation, there is just a heck of a lot more with precipitation due to the latent heat change in the air. Sensible heat change, what we can feel, is about 1/4 of the total heat change when moisture is removed from the air. This year there is a whole lot of precipitation going on as the floods in Australia and Brazil indicate, plus record snowfalls in the Northeastern US and Britain.
Precipitation accounts for a very large amount of heat transfer. The average Atlantic hurricane transfers about 600 trillion Watts per day from the troposphere to the low stratosphere. I lost the link to that estimate by NASA, but using 2260 Kilojoules per Kilogram of water, an average storm diameter of roughly 1250 kilometers and an average rainfall per day over that area of roughly 1 centimeter, you should get in that ballpark. Then there is other heat transfer like mixing of the ocean thanks to the waves which involves less energy but has an impact on sea surface temperatures. While 600 trillion watts per day is a big number, it is small in comparison to daily solar irradiation that is on the order of Zeta Watts (10^21). Then each year approximately 505,000 cubic kilometers of rain falls per year around the globe. There is 1x10^12 liters(kilograms of water)per cubic kilometer which yields 5.05x10^17 kilograms of rain at 2260 joules per kilogram yields 11.4x10^20 joules or about 1.14 zetajoules. Phew! These are getting to be big numbers!
One zetawatt is nothing compared to approximately 5500 zetawatts per year of solar irradiation at the top of the atmosphere(TOA). Rain though is not at the TOA, it is part of the turbulent climate activity at the bottom of the atmosphere where we live. So to get some kinda perspective the area of the Earth's surface is about 5.1x10^8 Kilometers squared which is 5.1x10^14 meters squared. Combining the two, precipitation accounts for about 2.2x10^6 Joules per meter squared per year of heat transfer, which is about 0.1 watt-hr/meter squared.
In addition to heat loss due to precipitation there is also energy reflected by the clouds associated with the weather systems that produce the rain. I haven't found a good rule of thumb for cloud cover per watt of heat loss due to precipitation. So I will give it a shot. Back to the average hurricane estimate we have roughly 1250 kilometer diameter of cloud cover for 600 trillion watts per day. The area of the storm is about 1.2 million kilometers squared which is 1.2 x 10^12 meters squared. That should give me 2 meters per watt-day or 0.08 meters per watt hour. Let's just round that off to 0.1 since it is my guesstimation. Since the tops of clouds are nice and bright white they should reflect nearly all the short wave radiation. The average incident radiation for the Earth, per the World Meteorological Organization for sunshine duration, is 120 watts per meter squared. For diurnal illumination I will assume 60 watts per square meter. That would yield about 6 watts per square meter reflected radiation. So reflected radiation due to cloud cover should be a good order of magnitude greater than the heat loss due to latent cooling of precipitation.
This rough rule of thumb is pretty crude, but it may be useful in figuring out negative cloud feed back based on precipitation change. Clouds are considered to be a positive feedback since they block outgoing radiation especially in dry environments. Winter clouds do tend to keep temperatures warmer as long as there is no significant precipitation associated with the cloud cover. Storm clouds are a different critter. They tend to be a negative feedback because of the associated convection. (This is a point of dispute, the whole reason I am considering this rule of thumb.)
The next question is how much more negative is the feedback compared to typical positive feedback? There is a lot of ongoing research in this area. The Tropical Warm Pool International Cloud Experiment is one group I know of. The problem is complex enough that I have not seen any definitive results yet.
This is kind of how it goes. The Earth is a gray body that radiates heat into space based on the Stefan-Boltzmann equation, W = e*delta*T^4, where W is watts per meter squared, e is the emissivity, delta is Stefan's constant 5.67x10^8 Joules/(second*meters^2*K^4) and T is absolute temperature in degrees K. So the right side of the equation is in Joules per second per meter squared which is the same as Watts per meter squared. The dimensionless term e for a black body is about 0.924 according to the Wein approximation. The Earth is not a true black body so the average emissivity is approximately 0.68 and typical cloud emissivity is thought to be about 0.5, lot of approximates and abouts aren't there? Here is a paper about one approach to the problem, Spectral Cloud Emissivities...
The problem is that clouds are part of the Earth and will radiate heat to space just like the planet surface. That radiation rate depends upon the same variables only at the top of the clouds the emissivity is approximately 0.924 (it is this emissivity the 2XCO2 will most greatly impact). Below the cloud, the surface radiation is being blocked by the clouds with an emissivity that varies. Since heat can flow due to conduction and convection, active moving clouds mix the heat through the cloud body negating some portion of the apparent lower emissivity. Blankets and insulation work because there is dead or virtually not moving air to reduce heat transfer due to conduction, convection and radiation. Those winter clouds that keep things warmer than you would think are like a blanket. They are just laying there nice a quiet. If he wind kicks up to 20 knots it is more than just wind chill that makes it colder, it is the clouds mixing temperatures which allows heat to escape also.
With a planet, energy in is pretty much equal to energy out at the top of the atmosphere. That makes it easier to get a guess how much the difference is between the local radiation balance of an area with precipitation cloud cover. Rain clouds block or reflect, most of the incoming radiation and about half of the outgoing radiation. So a good first guess is that rain clouds produce about 2 to 3 watts per meter squared of negative feedback. Note that is not all clouds, only clouds with precipitation.
If my rule of thumb happens to be in the ballpark, changes in precipitation would be a factor in global temperature change. Fine tuning the rule of thumb is bit more difficult.
There are a number of scientists and groups studying the nature of cloud impact on global climate. So this feeble attempt of mine has been done more accurately than I have in the past and will be further fine tuned in the future, I am sure. I rarely have truly original ideas, so here is very little likelihood that there is anything earth shattering here. It is a reasonable explanation of the complexity of cloud feedback.
In case you were wondering, the positive feedback of clouds has to be considered as well and it is more difficult track changes over time because of the lack of precipitation. So here is a brief look at positive cloud feedback from my perspective.
For positive feedback, clouds would have a rather low emissivity, ~0.5, and fairly high diffusion. How much light the clouds let through is an indication of how much solar radiation they are letting through. Simply, positive feedback cloud block more outgoing radiation than incoming.
This is more difficult to "see" because the infrared range of light outgoing is not in our visible spectrum. Patchy cirrus clouds let in a lot of visible light, so it would seem they would let out just as much infrared. which is not really the case.
At higher latitudes, where the air is typically drier, these clouds have a positive feedback or at least indicate the possibility of positive feedback. That sounds like I am hedging my bet, but there is a little logic to my reasoning.
Greenhouse gases have a higher impact in areas of lower relative or specific humidity. A desert is a good example. With clear skies, daytime temperatures can be over 100 degrees F and nighttime temperatures drop below 50 degrees F. With cloud cover that range can drop to below 100 F in the day and over 50 degrees F at night. The same cloud conditions in the humid tropics much less dramatic temperature wise because there is not as large a swing in emissivity which can be indicated by the specific humidity.
That may sound confusing, but you have to remember that water vapor is "the" main greenhouse gas. Water vapor is responsible for somewhere between 60% and 80% of the greenhouse effect while trace elements are responsible for between 6% and 15% of the greenhouse effect on a global average. As water vapor decreases, the well mixed trace gases remain about the same, so their percentage impact increases in a dry air environment. So cloud location impacts its positive feedback, high latitude clouds and clouds over desert areas produce more positive feedback than they would over the tropics.
Changes in average cloud cover can be an indicator of 2XCO2 feedback, but the local conditions where the increased cloud cover occurs determines how strong the feedback is. That is about as simple as I can explain it. Local dew point temperatures use to determine relative and specific humidity are probably the most inaccurate temperature measurements recorded. Satellite measurements are more accurate, but coverage and the length of records limit their usefulness.
Precipitation records, while not totally accurate, are long enough and have good enough accuracy to be useful. In addition, rainfall reconstructions tend to be more accurate than temperature reconstructions because rainfall has a greater impact on most proxies than temperature.

The US and Global Precipitation Anomalies to the left are from a US government site which I will include a link to soon. The Data for the US appears to be more complete so it is likely that a comparison to US temperature anomalies would be appropriate for fine tuning the rule of thumb. A quick eyeball indicates a correlation between temperature and precipitation trends. A more intelligent statistical approach will be needed to see if and how much correlation exists.
As I mentioned, the rule of thumb is crude at this point. Comparisons to other cloud/precipitation studies shows a variety of results on the magnitude and sign of cloud feedback.
My conclusion so far is to reconstruct past climate change and to provide model input to predict future climate change, precipitation change by region would appear to be an important factor. A reasonable rule of thumb for energy change associated with precipitation would help fine tune the model skill. Regional based models, where the accuracy of instrumental measurements can be more easily determined, should be better suited to determining a precipitation variation input for general climate models.
2/11/11
Just to add a few thoughts before I forget them. Low latitude precipitation reconstructions agree well with oscillation variations, but mid and high latitude reconstructions are more difficult to attribute to a particular oscillation due to the interaction of various oscillation with each other. Since high latitude temperature variation is much greater than tropical, it would be very easy to jump to wrong conclusions should precipitation lag/lead temperature.
Friday, January 28, 2011
Climate Change and Risk Assessment

This is a draft that I will be revising.
There is a scientific consensus that mankind's activities is causing our climate to change. The consensus starts to thin out when how much, how soon and what to do are discussed. The main culprit in Anthropogenic Global Warming (AGW) are the so called greenhouse gases with carbon dioxide being in the main role. I use the terms AGW and greenhouse gases, because Svante Arrhenius developed the theory around the turn of the 20th century.
Arrhenius theorized that atmospheric carbon dioxide concentration change was the driving force behind the cyclic glacial and interglacial periods in our history. Since he lived in the current Holecene Interglacial period, he calculated that halving atmospheric CO2 would decrease global temperature by about 4.5 degrees C and that doubling would increase temperature by about 5.5 degrees C. He defined the relationship between radiative forcing and carbon dioxide concentration as F=alpha*ln(C/Co). The constant, alpha, is derived via the Stephan-Bolzman law. His equation is still used today.
Another scientist of the day, Knut Angstrom, criticized Arrhenius' results based on the absorption bands of carbon dioxide (there was a mistake in Angstrom's experiment by the way). A decade later, Arrhenius revised his estimate for a doubling of CO2 to 1.6 degrees. While many skeptics of AGW use this revision to indicate that current climate sensitivity to CO2 doubling is over estimated, it is more likely that 1.6 is what Arrhenius considered to be the lower bound of sensitivity. Mistakes by both Arrhenius and Angstrom actually lead to a very reasonable range of climate sensitivity from 1.6 to 5.5 degrees C.
There is an extremely high probability that actual climate sensitivity lies in that range. That range though is too large to accurately determine the risk climate change places on us and our planet. The number of attempts to more accurately define sensitivity is large and growing. The current consensus is 2 to 4.5 degrees C. That consensus still leads to a wide range of uncertainty in calculating risk.
Dr. James Annan, is a scientist that studies the risk and potential economic impacts of climate change mitigation. (There is probably a better way of describing his work, but that is mine.) Using Bayesian Statistics, he has implied a sensitivity range of 1.3 to 3.7 degrees C. I use the term implied because the range and methods are far from definitive. Dr. Annan, very wisely, is calling for a multi-discipline approach to determining the most accurate estimate of climate sensitivity.
No statistical method can predict the unpredictable, so there will always be the possibility that sensitivity lies outside that range. There is always the possibility that the atmosphere will respond in a matter that will limit the impact of carbon dioxide doubling. For purposes of risk management, that range does illustrate the need for pragmatic action to reduce carbon dioxide emissions.
Given our need to reduce dependence on foreign oil, reduce ecological damage from fossil fuel use, transport and procurement and maintaining a relatively stable world economy, action needs to be taken anyway. From a decision making vantage it is enough to know that the climate is warming due in some measure to man's activities and the warming could be very bad!
A more accurate estimate of climate sensitivity is important to determine mitigation and adaption strategies for a warming environment. Realistically, substantial reductions in carbon emissions are unlikely before 2030. This makes alternate energy choices important by region and country, not only for economic reasons, but for reasons of adaption and mitigation.
So, in my mind the discussion of global warming should split into two paths. One, pragmatic action to reduce potential damage and two, action to improve our knowledge of climate sensitivity to decrease uncertainty.
With the exception of the 1.6 C revision by Arrhenius, most of the information discussed above is available at Wikipedia under Climate Sensitivity. Dr. Annan's papers discussed can be found here and here.
Subscribe to:
Posts (Atom)